SPIDER® Rock protection system - Geobrugg AG
SPIDER® Rock protection system - Geobrugg AG
SPIDER® Rock protection system - Geobrugg AG

Create successful ePaper yourself
Turn your PDF publications into a flip-book with our unique Google optimized e-Paper software.
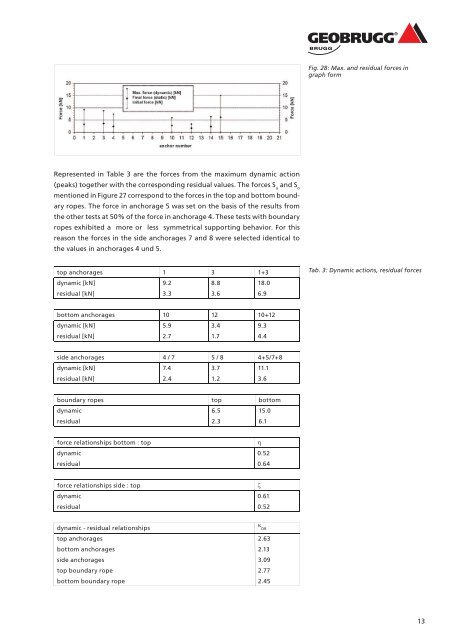
Represented in Table 3 are the forces from the maximum dynamic action<br />
(peaks) together with the corresponding residual values. The forces S u and S o<br />
mentioned in Figure 27 correspond to the forces in the top and bottom bound-<br />
ary ropes. The force in anchorage 5 was set on the basis of the results from<br />
the other tests at 50% of the force in anchorage 4. These tests with boundary<br />
ropes exhibited a more or less symmetrical supporting behavior. For this<br />
reason the forces in the side anchorages 7 and 8 were selected identical to<br />
the values in anchorages 4 und 5.<br />
top anchorages 1 3 1+3<br />
dynamic [kN]<br />
9.2<br />
8.8<br />
18.0<br />
residual [kN]<br />
3.3<br />
3.6<br />
6.9<br />
bottom anchorages 10 12 10+12<br />
dynamic [kN]<br />
5.9<br />
3.4<br />
9.3<br />
residual [kN]<br />
2.7<br />
1.7<br />
4.4<br />
side anchorages 4 / 7 5 / 8 4+5/7+8<br />
dynamic [kN]<br />
7.4<br />
3.7<br />
11.1<br />
residual [kN]<br />
2.4<br />
1.2<br />
3.6<br />
boundary ropes top bottom<br />
dynamic<br />
6.5<br />
15.0<br />
residual<br />
2.3<br />
6.1<br />
force relationships bottom : top η<br />
dynamic<br />
0.52<br />
residual<br />
0.64<br />
force relationships side : top ζ<br />
dynamic<br />
0.61<br />
residual<br />
0.52<br />
dynamic - residual relationships κ DR<br />
top anchorages 2.63<br />
bottom anchorages 2.13<br />
side anchorages 3.09<br />
top boundary rope 2.77<br />
bottom boundary rope 2.45<br />
Fig. 28: Max. and residual forces in<br />
graph form<br />
Tab. 3: Dynamic actions, residual forces<br />
13