Mask aspects of EUVL imaging at 27nm node and below
Mask aspects of EUVL imaging at 27nm node and below - Brion ...
Mask aspects of EUVL imaging at 27nm node and below - Brion ...
- No tags were found...

Create successful ePaper yourself
Turn your PDF publications into a flip-book with our unique Google optimized e-Paper software.
mask topography causes a number <strong>of</strong> effects which are unique to EUV, such as an HV CD <strong>of</strong>fset <strong>and</strong> an orient<strong>at</strong>ion<br />
dependent p<strong>at</strong>tern placement error. These so-called shadowing effects can be corrected by means <strong>of</strong> OPC, but also need<br />
to be considered in the mask stack design. The <strong>imaging</strong> performance (Exposure L<strong>at</strong>itude, <strong>Mask</strong> Error Enhancement<br />
Factor) can be optimized by an integral approach, taking the absorber thickness <strong>and</strong> mask bias into account.<br />
In this paper we will look into the impact <strong>of</strong> multilayer performance on <strong>imaging</strong> in terms <strong>of</strong> centroid wavelength tuning,<br />
absorber height <strong>and</strong> bias impact on <strong>imaging</strong> for 27 nm dense L/S in resist by means <strong>of</strong> wafers exposed on NXE:3100.<br />
Rigorous simul<strong>at</strong>ions are performed to evalu<strong>at</strong>e the possibilities for mask stack optimiz<strong>at</strong>ion for the NXE:3300 with 22<br />
nm <strong>node</strong>. Furthermore, we will look <strong>at</strong> the impact <strong>of</strong> EUV absorber reflectivity on CD uniformity due to image border<br />
reflections <strong>at</strong> the edges <strong>of</strong> the field <strong>and</strong> possible correction methods by means <strong>of</strong> mask OPC.<br />
2. MULTILAYER CENTROID WAVELENGTH OPTIMIZATION<br />
Multilayer is characterized by its reflectivity spectrum through EUV wavelength for different angles <strong>of</strong> incidence (AOI)<br />
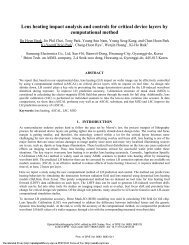
to the mask. On Figure 1 a measured reflectivity spectrum <strong>of</strong> a multilayer is shown for AOI <strong>of</strong> 6 degrees characterized by<br />
centroid wavelength, peak reflectivity <strong>and</strong> full width <strong>at</strong> half maximum. This spectrum was also successfully simul<strong>at</strong>ed in<br />
KLA-Tencor ProLith 3.2 s<strong>of</strong>tware using a rigorous Maxwell model <strong>and</strong> a detailed stack.<br />
Reflectivity<br />
70%<br />
60%<br />
50%<br />
40%<br />
30%<br />
20%<br />
10%<br />
Simul<strong>at</strong>ed ML<br />
reflectivity<br />
Measured ML<br />
reflectivity<br />
Centroid<br />
Wavelength<br />
~13.53 nm<br />
Peak<br />
Reflectivity<br />
~ 65%<br />
FWHM<br />
~0.5 nm<br />
0%<br />
12.5 13 13.5 14<br />
Wavelength, nm<br />
Figure 1 A measured <strong>and</strong> simul<strong>at</strong>ed multilayer reflectivity spectrum characterized by centroid wavelength, peak reflectivity <strong>and</strong> full<br />
width <strong>at</strong> half maximum (FWHM).<br />
A multilayer stack with 40-layers was optimized in order to m<strong>at</strong>ch peak reflectivity <strong>and</strong> full width <strong>at</strong> half maximum<br />
(FWHM) <strong>of</strong> a measured multilayer reflectivity spectrum (centroid wavelength can be easily m<strong>at</strong>ched by scaling <strong>of</strong> the<br />
ML stack thickness - see <strong>below</strong>). For this purpose thicknesses <strong>of</strong> two MoSi 2 intermixing layers were optimized. The<br />
resulting ML stack has the following thicknesses: 2.497 nm Si, 0.799 nm MoSi 2 , 1.897 nm Mo <strong>and</strong> 1.837 nm MoSi 2 with<br />
the total ML period <strong>of</strong> 7.03 nm. The accuracy <strong>of</strong> the m<strong>at</strong>ching was 0.26% for peak reflectivity <strong>and</strong> 0.0002 nm for<br />
FWHM. The usage <strong>of</strong> the intermixing layers in simul<strong>at</strong>ion seems to be unavoidable because otherwise peak reflectivity<br />
<strong>and</strong> FWHM <strong>of</strong> the spectrum are largely overestim<strong>at</strong>ed. The actual presence <strong>of</strong> the MoSi 2 intermixing layers was<br />
demonstr<strong>at</strong>ed in [1] by means <strong>of</strong> transmission electron spectroscopy (XTEM) showing the intermixing layers with<br />
thickness <strong>of</strong> 0.6 nm on Mo top <strong>and</strong> 1.7 nm on Si top with the full ML period <strong>of</strong> 6.95 nm <strong>and</strong> Mo/Si r<strong>at</strong>io <strong>of</strong> 0.4. Notice<br />
th<strong>at</strong> in our simul<strong>at</strong>ion we have kept the r<strong>at</strong>ios between the layers thickness close to these experimental values, while the<br />
total ML period was 1.5% increased in order to m<strong>at</strong>ch the centroid wavelength.<br />
If angle <strong>of</strong> incidence to the mask or ML stack thickness vary, the reflectivity spectrum change <strong>and</strong>, in particular, the<br />
centroid wavelength is shifted. This shift was simul<strong>at</strong>ed using the calibr<strong>at</strong>ed ML stack described above (Figure 2). The<br />
centroid wavelength grows linearly as a function <strong>of</strong> ML stack thickness <strong>and</strong> decreases quadr<strong>at</strong>ically through the angle <strong>of</strong><br />
incidence. This can be understood from a thin film interference approxim<strong>at</strong>ion. Peak (<strong>and</strong> centroid) wavelength are<br />
determined by an optical p<strong>at</strong>h difference (OPD) corresponding to constructive interference. OPD is described by the<br />
following equ<strong>at</strong>ion:<br />
Proc. <strong>of</strong> SPIE Vol. 8166 816624-2<br />
Downloaded From: http://proceedings.spiedigitallibrary.org/ on 04/08/2013 Terms <strong>of</strong> Use: http://spiedl.org/terms