Variations of Furfuryl alcohol and Wolmanit CX ... - Skog og landskap
Variations of Furfuryl alcohol and Wolmanit CX ... - Skog og landskap
Variations of Furfuryl alcohol and Wolmanit CX ... - Skog og landskap

You also want an ePaper? Increase the reach of your titles
YUMPU automatically turns print PDFs into web optimized ePapers that Google loves.
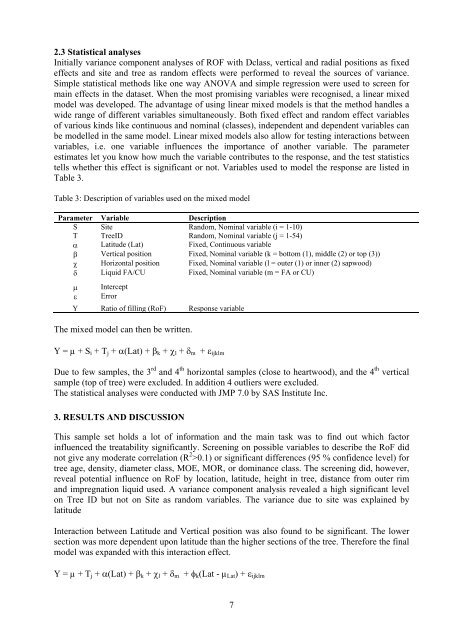
2.3 Statistical analyses<br />
Initially variance component analyses <strong>of</strong> ROF with Dclass, vertical <strong>and</strong> radial positions as fixed<br />
effects <strong>and</strong> site <strong>and</strong> tree as r<strong>and</strong>om effects were performed to reveal the sources <strong>of</strong> variance.<br />
Simple statistical methods like one way ANOVA <strong>and</strong> simple regression were used to screen for<br />
main effects in the dataset. When the most promising variables were rec<strong>og</strong>nised, a linear mixed<br />
model was developed. The advantage <strong>of</strong> using linear mixed models is that the method h<strong>and</strong>les a<br />
wide range <strong>of</strong> different variables simultaneously. Both fixed effect <strong>and</strong> r<strong>and</strong>om effect variables<br />
<strong>of</strong> various kinds like continuous <strong>and</strong> nominal (classes), independent <strong>and</strong> dependent variables can<br />
be modelled in the same model. Linear mixed models also allow for testing interactions between<br />
variables, i.e. one variable influences the importance <strong>of</strong> another variable. The parameter<br />
estimates let you know how much the variable contributes to the response, <strong>and</strong> the test statistics<br />
tells whether this effect is significant or not. Variables used to model the response are listed in<br />
Table 3.<br />
Table 3: Description <strong>of</strong> variables used on the mixed model<br />
Parameter Variable Description<br />
S Site R<strong>and</strong>om, Nominal variable (i = 1-10)<br />
T TreeID R<strong>and</strong>om, Nominal variable (j = 1-54)<br />
α Latitude (Lat) Fixed, Continuous variable<br />
β Vertical position Fixed, Nominal variable (k = bottom (1), middle (2) or top (3))<br />
χ Horizontal position Fixed, Nominal variable (l = outer (1) or inner (2) sapwood)<br />
δ Liquid FA/CU Fixed, Nominal variable (m = FA or CU)<br />
μ Intercept<br />
ε Error<br />
Y Ratio <strong>of</strong> filling (RoF) Response variable<br />
The mixed model can then be written.<br />
Y = µ + Si + Tj + α(Lat) + βk + χl + δm + εijklm<br />
Due to few samples, the 3 rd <strong>and</strong> 4 th horizontal samples (close to heartwood), <strong>and</strong> the 4 th vertical<br />
sample (top <strong>of</strong> tree) were excluded. In addition 4 outliers were excluded.<br />
The statistical analyses were conducted with JMP 7.0 by SAS Institute Inc.<br />
3. RESULTS AND DISCUSSION<br />
This sample set holds a lot <strong>of</strong> information <strong>and</strong> the main task was to find out which factor<br />
influenced the treatability significantly. Screening on possible variables to describe the RoF did<br />
not give any moderate correlation (R 2 >0.1) or significant differences (95 % confidence level) for<br />
tree age, density, diameter class, MOE, MOR, or dominance class. The screening did, however,<br />
reveal potential influence on RoF by location, latitude, height in tree, distance from outer rim<br />
<strong>and</strong> impregnation liquid used. A variance component analysis revealed a high significant level<br />
on Tree ID but not on Site as r<strong>and</strong>om variables. The variance due to site was explained by<br />
latitude<br />
Interaction between Latitude <strong>and</strong> Vertical position was also found to be significant. The lower<br />
section was more dependent upon latitude than the higher sections <strong>of</strong> the tree. Therefore the final<br />
model was exp<strong>and</strong>ed with this interaction effect.<br />
Y = µ + Tj + α(Lat) + βk + χl + δm + φk(Lat - µLat) + εijklm<br />
7