- Page 1 and 2:
www.it-ebooks.info
- Page 3 and 4:
AJAX and PHP Building Responsive We
- Page 5 and 6:
About the Authors Cristian Darie is
- Page 7 and 8:
About the Reviewers Emilian Balanes
- Page 9 and 10:
Table of Contents Preface 1 Chapter
- Page 11 and 12:
Table of Contents Chapter 6: AJAX S
- Page 13 and 14:
Preface AJAX is a complex phenomeno
- Page 15 and 16:
Preface What You Need for This Book
- Page 17 and 18:
Preface Errata Although we have tak
- Page 19 and 20:
1 AJAX and the Future of Web Applic
- Page 21 and 22:
Chapter 1 Because end-user satisfac
- Page 23 and 24:
Chapter 1 Three points for you to k
- Page 25 and 26:
Chapter 1 With JavaScript, develope
- Page 27 and 28:
interrupting the user from his or h
- Page 29 and 30:
• Creating simple online chat sol
- Page 31 and 32:
Chapter 1 done typing. (This method
- Page 33 and 34:
Chapter 1 All exercises from this b
- Page 35 and 36:
etrieve the user name $name = $_GET
- Page 37 and 38:
Chapter 1 If you're curious to test
- Page 39 and 40:
Chapter 1 request. In our case, thi
- Page 41 and 42:
2 Client-Side Techniques with Smart
- Page 43 and 44:
AJAX Foundations: JavaScript and
- Page 45 and 46:
Chapter 2 • Because there is no s
- Page 47 and 48:
Time for Action—Using JavaScript
- Page 49 and 50:
Even More DOM In the previous exerc
- Page 51 and 52:
Chapter 2 What Just Happened? Well,
- Page 53 and 54:
Chapter 2 font-size: 10pt; } .Table
- Page 55 and 56:
Chapter 2 Creating the XMLHttpReque
- Page 57 and 58:
Chapter 2 You could, for example, c
- Page 59 and 60:
You will learn the most interesting
- Page 61 and 62:
Chapter 2 The safer version of proc
- Page 63 and 64:
Chapter 2 4. Create a file call
- Page 65 and 66:
Chapter 2 Figure 2.6: The Four HTTP
- Page 67 and 68:
Chapter 2 } } else { // display sta
- Page 69 and 70:
Chapter 2 } { // try to create XMLH
- Page 71 and 72:
Chapter 2 The responseXML method of
- Page 73 and 74:
Chapter 2 Figure 2.10: Opera Displa
- Page 75 and 76:
I admit that the following piece of
- Page 77 and 78:
3 Server-Side Techniques with PHP a
- Page 79 and 80:
Chapter 3 } for (var i=0; i
- Page 81 and 82:
Chapter 3 // create the element $b
- Page 83 and 84:
Chapter 3 // create the root eleme
- Page 85 and 86:
Chapter 3 // read a file from the s
- Page 87 and 88:
Chapter 3 Figure 3.3: PHP Parameter
- Page 89 and 90:
Chapter 3 Without the customized er
- Page 91 and 92:
} } // display the error in case of
- Page 93 and 94:
Chapter 3 Figure 3.7: Connecting to
- Page 95 and 96:
Chapter 3 } } // continue only if H
- Page 97 and 98:
Chapter 3 You can make Firefox list
- Page 99 and 100:
Chapter 3 } "MSXML2.XMLHTTP.4.0", "
- Page 101 and 102:
'TEXT: ' . $errStr . chr(10) . 'LOC
- Page 103 and 104:
etrieve the parameters $num = 1; //
- Page 105 and 106:
Chapter 3 Figure 3.16: Flowchart De
- Page 107 and 108:
} Chapter 3 // only continue if xml
- Page 109 and 110:
} throw(response.length == 0 ? "Ser
- Page 111 and 112:
function process() { // ... if (req
- Page 113 and 114:
Chapter 3 Working with MySQL A back
- Page 115 and 116:
Chapter 3 Figure 3.17: Executing SQ
- Page 117 and 118:
Chapter 3 SELECT user_id, user_name
- Page 119 and 120:
3. In your foundations folder, crea
- Page 121 and 122:
Chapter 3 After these commands exec
- Page 123 and 124:
Chapter 3 • friendly.php is a PHP
- Page 125 and 126:
This example requires a JavaSc
- Page 127 and 128:
} } // try to connect to the server
- Page 129 and 130:
Chapter 3 } // create HTML-formatte
- Page 131 and 132:
Chapter 3 On the server side, all t
- Page 133 and 134:
4 AJAX Form Validation Validating i
- Page 135 and 136:
Chapter 4 Always validate user inpu
- Page 137 and 138:
Chapter 4 Figure 4.4: Successful Su
- Page 139 and 140:
Chapter 4 .left { margin-left: 150p
- Page 141 and 142:
Chapter 4 value="" />
- Page 143 and 144:
Registration Successfull! <<
- Page 145 and 146:
Chapter 4 } } { // display error me
- Page 147 and 148:
Chapter 4 require_once ('config.php
- Page 149 and 150:
Chapter 4 } { } $_POST['txtBthDay']
- Page 151 and 152:
Chapter 4 } } ?> return ($value ==
- Page 153 and 154: Chapter 4 The field ID and value re
- Page 155 and 156: Chapter 4 If we are dealing with cl
- Page 157 and 158: 5 AJAX Chat We are living in a worl
- Page 159 and 160: Chapter 5 Implementing AJAX Chat We
- Page 161 and 162: Chapter 5 // default the last id to
- Page 163 and 164: } Chapter 5 ' DATE_FORMAT(posted_on
- Page 165 and 166: Chapter 5 AJAX Chat Your b
- Page 167 and 168: * function called when the Send but
- Page 169 and 170: } } // retrieve the arrays from the
- Page 171 and 172: Chapter 5 } } } // call server asyn
- Page 173 and 174: Chapter 5 If you analyze the code f
- Page 175 and 176: The business logic behind chat.php
- Page 177 and 178: 6 AJAX Suggest and Autocomplete Sug
- Page 179 and 180: Chapter 6 The clever part of the Ja
- Page 181 and 182: Chapter 6 6. Create another file na
- Page 183 and 184: Chapter 6 { } a { } font-weight: bo
- Page 185 and 186: Chapter 6 } { // try to create XMLH
- Page 187 and 188: Chapter 6 } } } } { } displayError(
- Page 189 and 190: Chapter 6 div += "" + "" + crtFunct
- Page 191 and 192: } } // select the new suggestion an
- Page 193 and 194: Chapter 6 } } else // FF if (oText.
- Page 195 and 196: Chapter 6 Figure 6.4: PHP Documenta
- Page 197 and 198: Chapter 6 We have talked about cach
- Page 199 and 200: Chapter 6 visible, we need to scrol
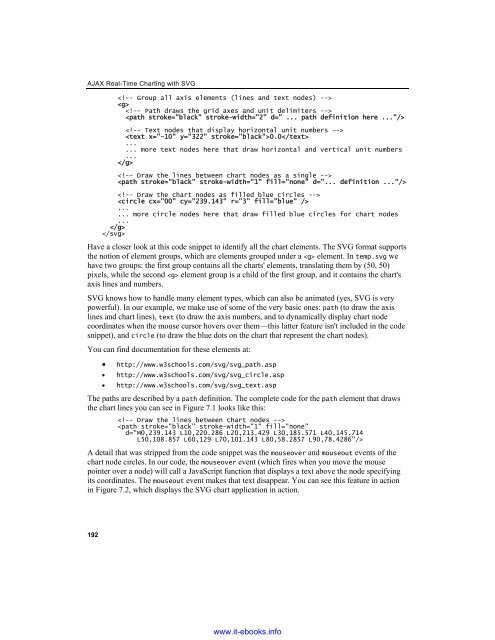
- Page 201 and 202: 7 AJAX Real-Time Charting with SVG
- Page 203: Chapter 7 Figure 7.1: SVG Chart The
- Page 207 and 208: Chapter 7 } { xmlHttp.onreadystatec
- Page 209 and 210: } } // sets the X and Y attributes
- Page 211 and 212: Chapter 7 } // Supported by Mozilla
- Page 213 and 214: Chapter 7 • All HTTP requests go
- Page 215 and 216: 8 AJAX Grid Data grids have always
- Page 217 and 218: Chapter 8 Figure 8.2: AJAX Grid in
- Page 219 and 220: $name = $_GET['name']; // update th
- Page 221 and 222: } Chapter 8 if (!isset($_SESSION['r
- Page 223 and 224: Chapter 8 # editId(, true) Edit
- Page 225 and 226: Chapter 8 } // this should work for
- Page 227 and 228: } Chapter 8 if(editableId) editId(e
- Page 229 and 230: } color: darkblue; text-align: righ
- Page 231 and 232: Chapter 8 On the client, this data
- Page 233 and 234: Chapter 8 save() and undo() are hel
- Page 235 and 236: 9 AJAX RSS Reader In the last few y
- Page 237 and 238: Chapter 9 Figure 9.1: Managing RSS
- Page 239 and 240: header('Pragma: no-cache'); header(
- Page 241 and 242: Chapter 9 Loading feed... Abou
- Page 243 and 244: Chapter 9 } // continue if the proc
- Page 245 and 246: Chapter 9 } width: 410px; backgroun
- Page 247 and 248: And finally, we send the HTTP reque
- Page 249 and 250: 10 AJAX Drag and Drop When drag-and
- Page 251 and 252: Chapter 10 The Prototype features a
- Page 253 and 254: Chapter 10 When dropping a task on
- Page 255 and 256:
Chapter 10 DROP HERE TO DELETE
- Page 257 and 258:
header('Expires: Fri, 25 Dec 1980 0
- Page 259 and 260:
Chapter 10 } } } else if (action ==
- Page 261 and 262:
Chapter 10 11. Load http://localhos
- Page 263 and 264:
details are saved using a cache sys
- Page 265 and 266:
Chapter 10 Summary This is it! You'
- Page 267 and 268:
A Preparing Your Working Environmen
- Page 269 and 270:
Appendix A During installation you'
- Page 271 and 272:
Before going through any case studi
- Page 273 and 274:
Appendix A Preparing Your *nix Play
- Page 275 and 276:
8. Finally, point your web browser
- Page 277 and 278:
2. Write ajax in the Create a new d
- Page 279 and 280:
Index A abort() method, XMLHttpRequ
- Page 281 and 282:
exception handling, JavaScript, 43
- Page 283 and 284:
PHP Parameters and Error Handling r
- Page 285 and 286:
updateChart() function, realTimeCha