AJAX and PHP
You also want an ePaper? Increase the reach of your titles
YUMPU automatically turns print PDFs into web optimized ePapers that Google loves.
Chapter 7<br />
}<br />
{<br />
xmlHttp.onreadystatechange = h<strong>and</strong>leGettingResults;<br />
xmlHttp.open("GET", url, true);<br />
xmlHttp.send(null);<br />
}<br />
else<br />
// if the connection is busy, retry after 1 second<br />
setTimeout("ajaxRequest(url,callback)", 1000);<br />
// called when the state of the request changes<br />
function h<strong>and</strong>leGettingResults()<br />
{<br />
// move forward only if the transaction has completed<br />
if (xmlHttp.readyState == 4)<br />
{<br />
// a HTTP status of 200 indicates the transaction completed<br />
// successfully<br />
if (xmlHttp.status == 200)<br />
{<br />
// execute the callback function, passing the server response<br />
innerCallback(xmlHttp.responseText)<br />
}<br />
else<br />
{<br />
// display error message<br />
alert("Couldn't connect to server");<br />
}<br />
}<br />
}<br />
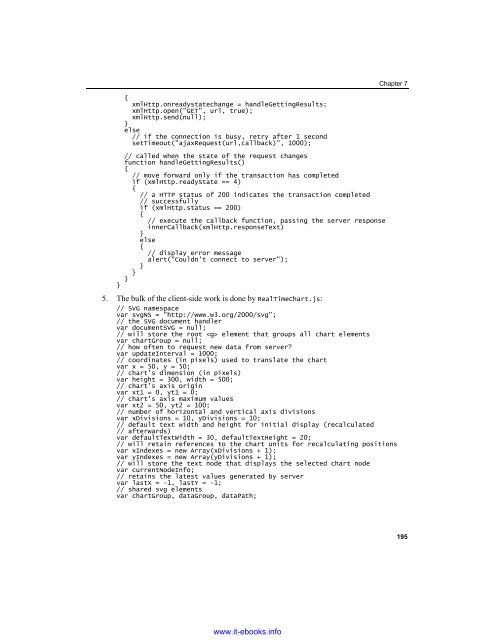
5. The bulk of the client-side work is done by RealTimeChart.js:<br />
// SVG namespace<br />
var svgNS = "http://www.w3.org/2000/svg";<br />
// the SVG document h<strong>and</strong>ler<br />
var documentSVG = null;<br />
// will store the root element that groups all chart elements<br />
var chartGroup = null;<br />
// how often to request new data from server?<br />
var updateInterval = 1000;<br />
// coordinates (in pixels) used to translate the chart<br />
var x = 50, y = 50;<br />
// chart's dimension (in pixels)<br />
var height = 300, width = 500;<br />
// chart's axis origin<br />
var xt1 = 0, yt1 = 0;<br />
// chart's axis maximum values<br />
var xt2 = 50, yt2 = 100;<br />
// number of horizontal <strong>and</strong> vertical axis divisions<br />
var xDivisions = 10, yDivisions = 10;<br />
// default text width <strong>and</strong> height for initial display (recalculated<br />
// afterwards)<br />
var defaultTextWidth = 30, defaultTextHeight = 20;<br />
// will retain references to the chart units for recalculating positions<br />
var xIndexes = new Array(xDivisions + 1);<br />
var yIndexes = new Array(yDivisions + 1);<br />
// will store the text node that displays the selected chart node<br />
var currentNodeInfo;<br />
// retains the latest values generated by server<br />
var lastX = -1, lastY = -1;<br />
// shared svg elements<br />
var chartGroup, dataGroup, dataPath;<br />
195<br />
www.it-ebooks.info


