Evaluating the “Good Death” Concept from Iranian Bereaved Family
Evaluating the “Good Death” Concept from Iranian Bereaved Family
Evaluating the “Good Death” Concept from Iranian Bereaved Family

You also want an ePaper? Increase the reach of your titles
YUMPU automatically turns print PDFs into web optimized ePapers that Google loves.
Estimating MIDs for <strong>the</strong> Worst Pain Rating of <strong>the</strong> BPI-SF<br />
A one-category change was defined as a one-point change<br />
for <strong>the</strong> BPI-SF current pain item, a one-point change for <strong>the</strong><br />
EQ-5D pain item, a three-point change for <strong>the</strong> FACT-G<br />
Physical Well-Being scale, 13 a six-point change for <strong>the</strong><br />
FACT-G total and FACT-B TOI scores, 14 and a 0.20 change<br />
for <strong>the</strong> EQ-5D Index score. For <strong>the</strong> selected interval and<br />
anchors, <strong>the</strong> mean change in BPI-SF worst pain item that<br />
corresponds to a one-category increase and decrease in each<br />
anchor was calculated. In addition, ordinary least squares<br />
regression models were used to regress changes in BPI-SF<br />
worst pain ratings on changes of each of <strong>the</strong> anchors. 15,16 The<br />
regression models included main effects for change in each<br />
anchor and an interaction term expressing <strong>the</strong> change in<br />
anchor-by-baseline anchor.<br />
DISTRIBUTION-BASED ANALYSIS<br />
The following distribution-based measures were calculated<br />
for <strong>the</strong> BPI-SF worst pain item: (1) <strong>the</strong> SEM, (2) effect size<br />
(Cohen’s d), and (3) Guyatt’s statistic. The SEM is a measure<br />
of <strong>the</strong> precision of a test instrument. It is calculated on <strong>the</strong><br />
basis of sample data using <strong>the</strong> sample standard deviation and<br />
<strong>the</strong> sample reliability coefficient. While <strong>the</strong> standard deviation<br />
and <strong>the</strong> reliability of a measure are sample-dependent,<br />
<strong>the</strong>ir relationship (and hence <strong>the</strong> SEM) remains relatively<br />
constant across samples. Therefore, <strong>the</strong> SEM is considered to<br />
be an attribute of <strong>the</strong> measure and not a characteristic of <strong>the</strong><br />
sample per se. 17 Threshold values of 1 SEM have been suggested<br />
for defining clinically meaningful differences. 18 The<br />
reliability coefficient was estimated for <strong>the</strong> BPI-SF worst pain<br />
item by calculating <strong>the</strong> intraclass correlation coefficients<br />
(ICCs) using two intervals of time. One used 7 days (days<br />
1–8), a more typical interval for assessing reproducibility,<br />
while <strong>the</strong> o<strong>the</strong>r approach used a later interval, <strong>from</strong> week 105<br />
to week 109. (Note: The 1-month interval was dictated by<br />
<strong>the</strong> schedule of assessments.) For both ICC values, only those<br />
patients whose FACT-B overall QOL ratings changed by 10%<br />
or less during <strong>the</strong> respective intervals were included. The 10%<br />
criterion was selected after reviewing <strong>the</strong> full distribution of<br />
change scores and <strong>the</strong>ir associated sample sizes, to arrive at a<br />
reasonable sample size of approximately 100 subjects.<br />
Cohen’s d, alternatively referred to as <strong>the</strong> “standardized<br />
effect size,” is calculated by dividing <strong>the</strong> difference between<br />
<strong>the</strong> baseline and week-25 scores by <strong>the</strong> standard deviation at<br />
baseline. 19 The effect size represents individual change in<br />
terms of <strong>the</strong> number of baseline standard deviations. A value<br />
of 0.20 is a small effect, 0.50 is a medium effect, and 0.80 is<br />
a large effect. Effect sizes of 0.20, 0.50, and 0.80 were calculated<br />
in this study.<br />
Guyatt’s statistic, also referred to as <strong>the</strong> “responsiveness<br />
statistic,” is calculated by dividing <strong>the</strong> difference between<br />
baseline and week-25 change by <strong>the</strong> standard deviation of<br />
change observed for a group of stable patients. 20 The denominator<br />
of <strong>the</strong> responsiveness statistics adjusts for spurious<br />
change due to measurement error. Values of 0.20 and 0.50<br />
have been used to represent “small” and “medium” changes,<br />
respectively. 21 Values representing 0.20 and 0.50 were calcu-<br />
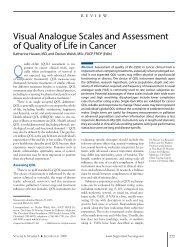
Table 1<br />
Demographic Characteristics<br />
CHARACTERISTIC, n (%) STUDY SAMPLE (n � 1,564)<br />
Gender<br />
Female 1,550 (99.1)<br />
Male 14 (0.9)<br />
Age, mean years � SD (range)<br />
Race<br />
57.2 � 11.2 (27.1–91.2)<br />
White 1,265 (80.9)<br />
Black 38 (2.4)<br />
Hispanic 92 (5.9)<br />
Japanese 119 (7.6)<br />
Asian 28 (1.8)<br />
O<strong>the</strong>r 22 (1.4)<br />
Demographic characteristics including <strong>the</strong> breakdown by gender, age, and race for <strong>the</strong><br />
study sample are shown.<br />
lated in this study. Stable patients were defined as those<br />
whose ECOG Performance rating did not change during <strong>the</strong><br />
assessment interval. A different variable was used in defining<br />
<strong>the</strong> stable population for purposes of calculating <strong>the</strong> SEM and<br />
Guyatt’s statistic because both variables were not consistently<br />
collected on <strong>the</strong> same schedule of assessments.<br />
INTEGRATING ANCHOR-BASED AND DISTRIBUTION-BASED<br />
MID ESTIMATES<br />
The minimal detectable change (MDC) for <strong>the</strong> worst pain<br />
item was established by comparing distribution-based estimates.<br />
The MDC represents <strong>the</strong> smallest change that can<br />
be reliably distinguished <strong>from</strong> random fluctuation and,<br />
thus, <strong>the</strong> lower bound for establishing <strong>the</strong> MID. 11 If <strong>the</strong><br />
MID were lower than <strong>the</strong> MDC, <strong>the</strong>n <strong>the</strong> instrument would<br />
not be capable of distinguishing <strong>the</strong> MID. The SEM was<br />
considered <strong>the</strong> primary distribution-based estimate because it<br />
takes into account <strong>the</strong> reliability of <strong>the</strong> measure and, thus,<br />
estimates <strong>the</strong> precision of <strong>the</strong> instrument. 11 O<strong>the</strong>r distribution-based<br />
measures were also considered in establishing <strong>the</strong><br />
MDC. Standardized effect size was considered a secondary<br />
distribution-based estimate because of its reliance on interperson<br />
variability, which is generally higher and less consistent<br />
than intraperson variability. Anchor-based estimates of<br />
<strong>the</strong> MID range were <strong>the</strong>n compared. A final MID range was<br />
established that is greater than <strong>the</strong> MDC and integrates<br />
estimates <strong>from</strong> <strong>the</strong> various anchors.<br />
Results<br />
PATIENT POPULATION<br />
Demographic and clinical characteristics for patients included<br />
in <strong>the</strong> baseline to week 25 interval are presented in<br />
Table 1. Data <strong>from</strong> 1,564 of 2,049 patients who participated<br />
in <strong>the</strong> study and had valid (i.e., nonmissing) baseline and endof-interval<br />
scores for <strong>the</strong> BPI-SF and anchors were used in <strong>the</strong>se<br />
analyses. Patients were predominantly female with an average<br />
age of 57.2 � 11.2 years. The majority of patients were white<br />
74 www.SupportiveOncology.net THE JOURNAL OF SUPPORTIVE ONCOLOGY