Evaluating the “Good Death” Concept from Iranian Bereaved Family
Evaluating the “Good Death” Concept from Iranian Bereaved Family
Evaluating the “Good Death” Concept from Iranian Bereaved Family

You also want an ePaper? Increase the reach of your titles
YUMPU automatically turns print PDFs into web optimized ePapers that Google loves.
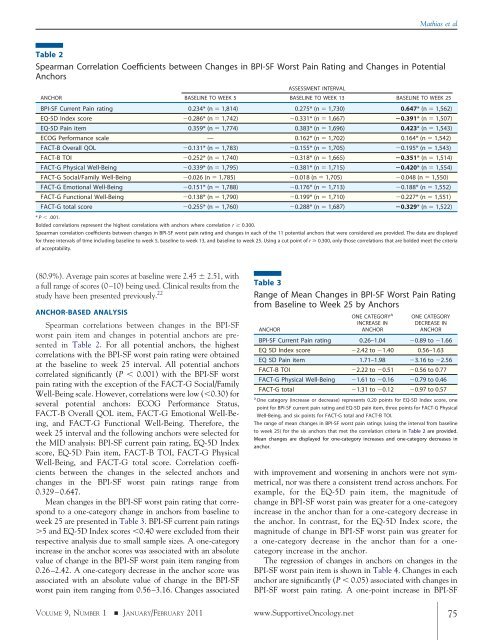
Table 2<br />
Spearman Correlation Coefficients between Changes in BPI-SF Worst Pain Rating and Changes in Potential<br />
Anchors<br />
ANCHOR<br />
BASELINE TO WEEK 5<br />
ASSESSMENT INTERVAL<br />
BASELINE TO WEEK 13 BASELINE TO WEEK 25<br />
BPI-SF Current Pain rating 0.234* (n � 1,814) 0.275* (n � 1,730) 0.647* (n� 1,562)<br />
EQ-5D Index score �0.286* (n � 1,742) �0.331* (n � 1,667) �0.391* (n� 1,507)<br />
EQ-5D Pain item 0.359* (n � 1,774) 0.383* (n � 1,696) 0.423* (n� 1,543)<br />
ECOG Performance scale — 0.162* (n � 1,702) 0.164* (n � 1,542)<br />
FACT-B Overall QOL �0.131* (n � 1,783) �0.155* (n � 1,705) �0.195* (n � 1,543)<br />
FACT-B TOI �0.252* (n � 1,740) �0.318* (n � 1,665) �0.351* (n� 1,514)<br />
FACT-G Physical Well-Being �0.339* (n � 1,795) �0.381* (n � 1,715) �0.420* (n� 1,554)<br />
FACT-G Social/<strong>Family</strong> Well-Being �0.026 (n � 1,785) �0.018 (n � 1,705) �0.048 (n � 1,550)<br />
FACT-G Emotional Well-Being �0.151* (n � 1,788) �0.176* (n � 1,713) �0.188* (n � 1,552)<br />
FACT-G Functional Well-Being �0.138* (n � 1,790) �0.199* (n � 1,710) �0.227* (n � 1,551)<br />
FACT-G total score �0.255* (n � 1,760) �0.288* (n � 1,687) �0.329* (n� 1,522)<br />
* P � .001.<br />
Bolded correlations represent <strong>the</strong> highest correlations with anchors where correlation r � 0.300.<br />
Spearman correlation coefficients between changes in BPI-SF worst pain rating and changes in each of <strong>the</strong> 11 potential anchors that were considered are provided. The data are displayed<br />
for three intervals of time including baseline to week 5, baseline to week 13, and baseline to week 25. Using a cut point of r � 0.300, only those correlations that are bolded meet <strong>the</strong> criteria<br />
of acceptability.<br />
(80.9%). Average pain scores at baseline were 2.45 � 2.51, with<br />
a full range of scores (0–10) being used. Clinical results <strong>from</strong> <strong>the</strong><br />
study have been presented previously. 22<br />
ANCHOR-BASED ANALYSIS<br />
Spearman correlations between changes in <strong>the</strong> BPI-SF<br />
worst pain item and changes in potential anchors are presented<br />
in Table 2. For all potential anchors, <strong>the</strong> highest<br />
correlations with <strong>the</strong> BPI-SF worst pain rating were obtained<br />
at <strong>the</strong> baseline to week 25 interval. All potential anchors<br />
correlated significantly (P � 0.001) with <strong>the</strong> BPI-SF worst<br />
pain rating with <strong>the</strong> exception of <strong>the</strong> FACT-G Social/<strong>Family</strong><br />
Well-Being scale. However, correlations were low (�0.30) for<br />
several potential anchors: ECOG Performance Status,<br />
FACT-B Overall QOL item, FACT-G Emotional Well-Being,<br />
and FACT-G Functional Well-Being. Therefore, <strong>the</strong><br />
week 25 interval and <strong>the</strong> following anchors were selected for<br />
<strong>the</strong> MID analysis: BPI-SF current pain rating, EQ-5D Index<br />
score, EQ-5D Pain item, FACT-B TOI, FACT-G Physical<br />
Well-Being, and FACT-G total score. Correlation coefficients<br />
between <strong>the</strong> changes in <strong>the</strong> selected anchors and<br />
changes in <strong>the</strong> BPI-SF worst pain ratings range <strong>from</strong><br />
0.329–0.647.<br />
Mean changes in <strong>the</strong> BPI-SF worst pain rating that correspond<br />
to a one-category change in anchors <strong>from</strong> baseline to<br />
week 25 are presented in Table 3. BPI-SF current pain ratings<br />
�5 and EQ-5D Index scores �0.40 were excluded <strong>from</strong> <strong>the</strong>ir<br />
respective analysis due to small sample sizes. A one-category<br />
increase in <strong>the</strong> anchor scores was associated with an absolute<br />
value of change in <strong>the</strong> BPI-SF worst pain item ranging <strong>from</strong><br />
0.26–2.42. A one-category decrease in <strong>the</strong> anchor score was<br />
associated with an absolute value of change in <strong>the</strong> BPI-SF<br />
worst pain item ranging <strong>from</strong> 0.56–3.16. Changes associated<br />
Mathias et al<br />
Table 3<br />
Range of Mean Changes in BPI-SF Worst Pain Rating<br />
<strong>from</strong> Baseline to Week 25 by Anchors<br />
ONE CATEGORY<br />
ANCHOR<br />
A ONE CATEGORY<br />
INCREASE IN DECREASE IN<br />
ANCHOR<br />
ANCHOR<br />
BPI-SF Current Pain rating 0.26–1.04 �0.89 to �1.66<br />
EQ 5D Index score �2.42 to �1.40 0.56–1.63<br />
EQ 5D Pain item 1.71–1.98 �3.16 to �2.56<br />
FACT-B TOI �2.22 to �0.51 �0.56 to 0.77<br />
FACT-G Physical Well-Being �1.61 to �0.16 �0.79 to 0.46<br />
FACT-G total �1.31 to �0.12 �0.97 to 0.57<br />
a One category (increase or decrease) represents 0.20 points for EQ-5D Index score, one<br />
point for BPI-SF current pain rating and EQ-5D pain item, three points for FACT-G Physical<br />
Well-Being, and six points for FACT-G total and FACT-B TOI.<br />
The range of mean changes in BPI-SF worst pain ratings (using <strong>the</strong> interval <strong>from</strong> baseline<br />
to week 25) for <strong>the</strong> six anchors that met <strong>the</strong> correlation criteria in Table 2 are provided.<br />
Mean changes are displayed for one-category increases and one-category decreases in<br />
anchor.<br />
with improvement and worsening in anchors were not symmetrical,<br />
nor was <strong>the</strong>re a consistent trend across anchors. For<br />
example, for <strong>the</strong> EQ-5D pain item, <strong>the</strong> magnitude of<br />
change in BPI-SF worst pain was greater for a one-category<br />
increase in <strong>the</strong> anchor than for a one-category decrease in<br />
<strong>the</strong> anchor. In contrast, for <strong>the</strong> EQ-5D Index score, <strong>the</strong><br />
magnitude of change in BPI-SF worst pain was greater for<br />
a one-category decrease in <strong>the</strong> anchor than for a onecategory<br />
increase in <strong>the</strong> anchor.<br />
The regression of changes in anchors on changes in <strong>the</strong><br />
BPI-SF worst pain item is shown in Table 4. Changes in each<br />
anchor are significantly (P � 0.05) associated with changes in<br />
BPI-SF worst pain rating. A one-point increase in BPI-SF<br />
VOLUME 9, NUMBER 1 � JANUARY/FEBRUARY 2011 www.SupportiveOncology.net 75