- Page 1: Regional State of the Coast Report
- Page 4 and 5: Published by the United Nations Env
- Page 6 and 7: IV Regional State of the Coast Repo
- Page 8 and 9: VI Regional State of the Coast Repo
- Page 10 and 11: VIII Regional State of the Coast Re
- Page 12 and 13: Acknowledgements And lastly…, In
- Page 14 and 15: XII Regional State of the Coast Rep
- Page 16 and 17: List of Contributors José PAULA MA
- Page 18 and 19: XVI Regional State of the Coast Rep
- Page 20 and 21: Chapter 10. Threatened MARINE speci
- Page 22: Chapter 35. Coastal and marine rese
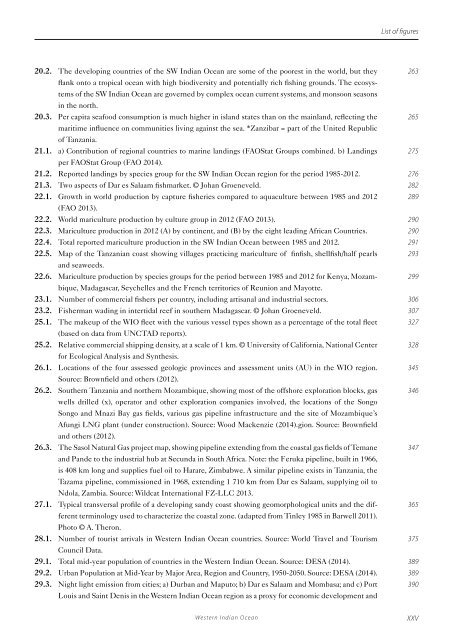
- Page 28: List of figures urbanisation. Sourc
- Page 32: List of tables 18.1. World Heritage
- Page 36: List of boxes 29.2. Cities at risk:
- Page 40 and 41: I . Summary 2 Regional State of the
- Page 42 and 43: I . Summary 4 Regional State of the
- Page 44 and 45: I . Summary 6 Regional State of the
- Page 47 and 48: Part II The Context of the Assessme
- Page 49: 1 Planet: Oceans and Life 13 • PA
- Page 52 and 53: II . The context of the assessment
- Page 54 and 55: II . The context of the assessment
- Page 56 and 57: II . The context of the assessment
- Page 58 and 59: II . The context of the assessment
- Page 60 and 61: II . The context of the assessment
- Page 63 and 64: 2 Mandate and Methodology Julius Fr
- Page 65 and 66: 2. Mandate and methodology nizes th
- Page 67 and 68: 2. Mandate and methodology ported t
- Page 69: 2. Mandate and methodology Western
- Page 72 and 73: III . Assessment of marine biologic
- Page 75 and 76: 3 Introduction - Biodiversity Micha
- Page 77:
3. Introduction - biodiversity West
- Page 80 and 81:
III . Assessment of marine biologic
- Page 82 and 83:
III . Assessment of marine biologic
- Page 84 and 85:
III . Assessment of marine biologic
- Page 86 and 87:
III . Assessment of marine biologic
- Page 88 and 89:
III . Assessment of marine biologic
- Page 91 and 92:
5 Mangroves, Salt Marshes and Seagr
- Page 93 and 94:
5. Mangroves, salt marshes and seag
- Page 95 and 96:
5. Mangroves, salt marshes and seag
- Page 97 and 98:
5. Mangroves, salt marshes and seag
- Page 99 and 100:
5. Mangroves, salt marshes and seag
- Page 101 and 102:
5. Mangroves, salt marshes and seag
- Page 103 and 104:
5. Mangroves, salt marshes and seag
- Page 105 and 106:
5. Mangroves, salt marshes and seag
- Page 107:
5. Mangroves, salt marshes and seag
- Page 110 and 111:
III . Assessment of marine biologic
- Page 112 and 113:
III . Assessment of marine biologic
- Page 114 and 115:
III . Assessment of marine biologic
- Page 116 and 117:
III . Assessment of marine biologic
- Page 118 and 119:
III . Assessment of marine biologic
- Page 120 and 121:
III . Assessment of marine biologic
- Page 123 and 124:
7 Intertidal and Nearshore Rocky Re
- Page 125 and 126:
7. Intertidal and nearshore rocky r
- Page 127 and 128:
7. Intertidal and nearshore rocky r
- Page 129 and 130:
7. Intertidal and nearshore rocky r
- Page 131 and 132:
7. Intertidal and nearshore rocky r
- Page 133 and 134:
7. Intertidal and nearshore rocky r
- Page 135 and 136:
7. Intertidal and nearshore rocky r
- Page 137 and 138:
7. Intertidal and nearshore rocky r
- Page 139:
7. Intertidal and nearshore rocky r
- Page 142 and 143:
III . Assessment of marine biologic
- Page 144 and 145:
III . Assessment of marine biologic
- Page 146 and 147:
III . Assessment of marine biologic
- Page 148 and 149:
III . Assessment of marine biologic
- Page 150 and 151:
III . Assessment of marine biologic
- Page 153 and 154:
9 Deep sea and Offshore/Pelagic Hab
- Page 155 and 156:
9. Deep sea and offshore/pelagic ha
- Page 157 and 158:
9. Deep sea and offshore/pelagic ha
- Page 159 and 160:
9. Deep sea and offshore/pelagic ha
- Page 161 and 162:
9. Deep sea and offshore/pelagic ha
- Page 163 and 164:
9. Deep sea and offshore/pelagic ha
- Page 165:
9. Deep sea and offshore/pelagic ha
- Page 168 and 169:
III . Assessment of marine biologic
- Page 170 and 171:
III . Assessment of marine biologic
- Page 172 and 173:
III . Assessment of marine biologic
- Page 174 and 175:
III . Assessment of marine biologic
- Page 176 and 177:
III . Assessment of marine biologic
- Page 178 and 179:
III . Assessment of marine biologic
- Page 180 and 181:
III . Assessment of marine biologic
- Page 182 and 183:
III . Assessment of marine biologic
- Page 184 and 185:
III . Assessment of marine biologic
- Page 186 and 187:
III . Assessment of marine biologic
- Page 188 and 189:
III . Assessment of marine biologic
- Page 191 and 192:
11 Significant Social and Economic
- Page 193 and 194:
11. Significant social and economic
- Page 195 and 196:
11. Significant social and economic
- Page 197 and 198:
11. Significant social and economic
- Page 199 and 200:
11. Significant social and economic
- Page 201 and 202:
11. Significant social and economic
- Page 203:
11. Significant social and economic
- Page 206 and 207:
III . Assessment of marine biologic
- Page 208 and 209:
III . Assessment of marine biologic
- Page 211 and 212:
Part IV Assessment of Major Ecosyst
- Page 213:
17 Ocean-sourced Carbonate Producti
- Page 216 and 217:
IV . Assessment of major ecosystem
- Page 218 and 219:
IV . Assessment of major ecosystem
- Page 220 and 221:
IV . Assessment of major ecosystem
- Page 222 and 223:
IV . Assessment of major ecosystem
- Page 225 and 226:
14 The Oceans’ Role in the Hydrol
- Page 227 and 228:
14. The ocean’s role in the hydro
- Page 229 and 230:
14. The ocean’s role in the hydro
- Page 231 and 232:
14. The ocean’s role in the hydro
- Page 233 and 234:
14. The ocean’s role in the hydro
- Page 235:
14. The ocean’s role in the hydro
- Page 238 and 239:
IV . Assessment of major ecosystem
- Page 240 and 241:
IV . Assessment of major ecosystem
- Page 242 and 243:
IV . Assessment of major ecosystem
- Page 244 and 245:
IV . Assessment of major ecosystem
- Page 246 and 247:
IV . Assessment of major ecosystem
- Page 248 and 249:
IV . Assessment of major ecosystem
- Page 251 and 252:
16 Phytoplankton Primary Production
- Page 253 and 254:
16. Phytoplankton primary productio
- Page 255 and 256:
16. Phytoplankton primary productio
- Page 257 and 258:
16. Phytoplankton primary productio
- Page 259 and 260:
16. Phytoplankton primary productio
- Page 261 and 262:
16. Phytoplankton primary productio
- Page 263 and 264:
16. Phytoplankton primary productio
- Page 265 and 266:
16. Phytoplankton primary productio
- Page 267 and 268:
16. Phytoplankton primary productio
- Page 269:
16. Phytoplankton primary productio
- Page 272 and 273:
IV . Assessment of major ecosystem
- Page 274 and 275:
IV . Assessment of major ecosystem
- Page 276 and 277:
IV . Assessment of major ecosystem
- Page 278 and 279:
IV . Assessment of major ecosystem
- Page 281 and 282:
18 Aesthetic, Cultural and Spiritua
- Page 283 and 284:
18. Aesthetic, cultural and spiritu
- Page 285 and 286:
18. Aesthetic, cultural and spiritu
- Page 287 and 288:
18. Aesthetic, cultural and spiritu
- Page 289:
18. Aesthetic, cultural and spiritu
- Page 292 and 293:
IV . Assessment of major ecosystem
- Page 295 and 296:
Part V Assessment of Food Security
- Page 297:
22 Mariculture 289 20 The Western I
- Page 300 and 301:
V . Assessment of food security fro
- Page 302 and 303:
V . Assessment of food security fro
- Page 304 and 305:
V . Assessment of food security fro
- Page 306 and 307:
V . Assessment of food security fro
- Page 308 and 309:
V . Assessment of food security fro
- Page 311 and 312:
21 Capture Fisheries Johan Groeneve
- Page 313 and 314:
21. Capture fisheries 140000 a) All
- Page 315 and 316:
21. Capture fisheries and sticks. M
- Page 317 and 318:
21. Capture fisheries require far g
- Page 319 and 320:
21. Capture fisheries Ocean, with S
- Page 321 and 322:
21. Capture fisheries gress was mad
- Page 323 and 324:
21. Capture fisheries (2006). Seaso
- Page 325:
21. Capture fisheries Western India
- Page 328 and 329:
V . Assessment of food security fro
- Page 330 and 331:
V . Assessment of food security fro
- Page 332 and 333:
V . Assessment of food security fro
- Page 334 and 335:
V . Assessment of food security fro
- Page 336 and 337:
V . Assessment of food security fro
- Page 338 and 339:
V . Assessment of food security fro
- Page 340 and 341:
V . Assessment of food security fro
- Page 343 and 344:
23 Social and Economic Impacts of C
- Page 345 and 346:
23. Social economic impacts of capt
- Page 347 and 348:
23. Social economic impacts of capt
- Page 349 and 350:
23. Social economic impacts of capt
- Page 351 and 352:
23. Social economic impacts of capt
- Page 353:
23. Social economic impacts of capt
- Page 356 and 357:
V . Assessment of food security fro
- Page 358 and 359:
V . Assessment of food security fro
- Page 361 and 362:
Part VI Assessment of Other Human A
- Page 363:
• TRAJECTORY AND CONCLUSIONS 355
- Page 366 and 367:
VI . Assessment of other human acti
- Page 368 and 369:
VI . Assessment of other human acti
- Page 370 and 371:
VI . Assessment of other human acti
- Page 372 and 373:
VI . Assessment of other human acti
- Page 374 and 375:
VI . Assessment of other human acti
- Page 376 and 377:
VI . Assessment of other human acti
- Page 378 and 379:
VI . Assessment of other human acti
- Page 381 and 382:
26 Oil, Gas and Renewable Energy Ma
- Page 383 and 384:
26. Oil, gas and renewable energy g
- Page 385 and 386:
26. Oil, gas and renewable energy A
- Page 387 and 388:
26. Oil, gas and renewable energy B
- Page 389 and 390:
26. Oil, gas and renewable energy B
- Page 391 and 392:
26. Oil, gas and renewable energy e
- Page 393 and 394:
26. Oil, gas and renewable energy e
- Page 395 and 396:
26. Oil, gas and renewable energy R
- Page 397:
26. Oil, gas and renewable energy a
- Page 400 and 401:
VI . Assessment of other human acti
- Page 402 and 403:
VI . Assessment of other human acti
- Page 404 and 405:
VI . Assessment of other human acti
- Page 406 and 407:
VI . Assessment of other human acti
- Page 408 and 409:
VI . Assessment of other human acti
- Page 411 and 412:
28 Tourism and Recreation Sachooda
- Page 413 and 414:
28. Tourism and recreation Seychell
- Page 415 and 416:
28. Tourism and recreation Table 28
- Page 417 and 418:
28. Tourism and recreation BOX 28.2
- Page 419 and 420:
28. Tourism and recreation establis
- Page 421 and 422:
28. Tourism and recreation December
- Page 423:
28. Tourism and recreation Western
- Page 426 and 427:
VI . Assessment of other human acti
- Page 428 and 429:
VI . Assessment of other human acti
- Page 430 and 431:
VI . Assessment of other human acti
- Page 432 and 433:
VI . Assessment of other human acti
- Page 434 and 435:
VI . Assessment of other human acti
- Page 436 and 437:
VI . Assessment of other human acti
- Page 438 and 439:
VI . Assessment of other human acti
- Page 440 and 441:
VI . Assessment of other human acti
- Page 442 and 443:
VI . Assessment of other human acti
- Page 445 and 446:
30 Marine Genetic Resources and Bio
- Page 447 and 448:
30. Marine genetic resources and bi
- Page 449 and 450:
30. Marine genetic resources and bi
- Page 451 and 452:
30. Marine genetic resources and bi
- Page 453 and 454:
30. Marine genetic resources and bi
- Page 455:
30. Marine genetic resources and bi
- Page 458 and 459:
VI . Assessment of other human acti
- Page 461 and 462:
Part VII Scenarios, Policy Options
- Page 463:
• World Wide Fund for Nature (WWF
- Page 466 and 467:
VII . Scenarios, policy options and
- Page 468 and 469:
VII . Scenarios, policy options and
- Page 470 and 471:
VII . Scenarios, policy options and
- Page 472 and 473:
VII . Scenarios, policy options and
- Page 474 and 475:
VII . Scenarios, policy options and
- Page 476 and 477:
VII . Scenarios, policy options and
- Page 478 and 479:
VII . Scenarios, policy options and
- Page 480 and 481:
VII . Scenarios, policy options and
- Page 483 and 484:
33 Governance: Legal and Institutio
- Page 485 and 486:
33. Governance: legal and instituti
- Page 487 and 488:
33. Governance: legal and instituti
- Page 489 and 490:
33. Governance: legal and instituti
- Page 491 and 492:
33. Governance: legal and instituti
- Page 493 and 494:
33. Governance: legal and instituti
- Page 495:
33. Governance: legal and instituti
- Page 498 and 499:
VII . Scenarios, policy options and
- Page 500 and 501:
VII . Scenarios, policy options and
- Page 502 and 503:
VII . Scenarios, policy options and
- Page 504 and 505:
VII . Scenarios, policy options and
- Page 506 and 507:
VII . Scenarios, policy options and
- Page 508 and 509:
VII . Scenarios, policy options and
- Page 511 and 512:
35 Coastal and Marine Research and
- Page 513 and 514:
35. Coastal and marine research and
- Page 515 and 516:
35. Coastal and marine research and
- Page 517 and 518:
35. Coastal and marine research and
- Page 519 and 520:
35. Coastal and marine research and
- Page 521 and 522:
35. Coastal and marine research and
- Page 523 and 524:
35. Coastal and marine research and
- Page 525 and 526:
35. Coastal and marine research and
- Page 527 and 528:
35. Coastal and marine research and
- Page 529 and 530:
35. Coastal and marine research and
- Page 531 and 532:
35. Coastal and marine research and
- Page 533:
35. Coastal and marine research and
- Page 536 and 537:
VIII . Overall assessment 498 Regio
- Page 539 and 540:
36 Overall Assessment of the State
- Page 541 and 542:
36. Overall assessment of the state
- Page 543 and 544:
36. Overall assessment of the state
- Page 545 and 546:
36. Overall assessment of the state
- Page 547 and 548:
36. Overall assessment of the state
- Page 549 and 550:
36. Overall assessment of the state
- Page 551 and 552:
36. Overall assessment of the state
- Page 553 and 554:
36. Overall assessment of the state
- Page 555 and 556:
36. Overall assessment of the state
- Page 557 and 558:
36. Overall assessment of the state
- Page 559 and 560:
36. Overall assessment of the state
- Page 561 and 562:
36. Overall assessment of the state
- Page 563 and 564:
36. Overall assessment of the state
- Page 565:
36. Overall assessment of the state
- Page 568 and 569:
Abbreviations EAC EACC EAF EARO EAW
- Page 570 and 571:
Abbreviations NDEIE NDS NEAP NEC NE
- Page 573 and 574:
GLOSSARY A Abiotic Factor - non-liv
- Page 575 and 576:
Glossary Carbon Sink - natural syst
- Page 577 and 578:
Glossary Environmental Stress - pre
- Page 579 and 580:
Glossary Hatchery - place where egg
- Page 581 and 582:
Glossary Near Shore - region of lan
- Page 583 and 584:
Glossary Snorkelling - the practice


