

Inclusive social development: The next generation of policies for overcoming poverty and reducing inequality in Latin America and the Caribbean
The Latin American and Caribbean region has achieved notable social development in the past decade. However, much remains to be done. The persisting challenges of defeating poverty once and for all and significantly reducing inequality are not only ethical imperatives but also conditions for making progress toward sustainable development, consistently with the recently adopted 2030 Agenda for Sustainable Development. Although the global economy is more complex and uncertain now than in previous years, and prospects for the region are not —in the short term, at least— particularly bright, it is crucial to secure the progress made in social development in the past decade and lose no time in tackling unresolved issues in areas where progress has been insufficient.
The Latin American and Caribbean region has achieved notable social development in the past decade. However, much remains to be done. The persisting challenges of defeating poverty once and for all and significantly reducing inequality are not only ethical imperatives but also conditions for making progress toward sustainable development, consistently with the recently adopted 2030 Agenda for Sustainable Development.
Although the global economy is more complex and uncertain now than in previous years, and prospects for the region are not —in the short term, at least— particularly bright, it is crucial to secure the progress made in social development in the past decade and lose no time in tackling unresolved issues in areas where progress has been insufficient.

You also want an ePaper? Increase the reach of your titles
YUMPU automatically turns print PDFs into web optimized ePapers that Google loves.
<strong>Inclusive</strong> <strong>social</strong> <strong>development</strong>: <strong>the</strong> <strong>next</strong> <strong>generation</strong> <strong>of</strong> <strong>policies</strong> <strong>for</strong> <strong>overcom<strong>in</strong>g</strong> <strong>poverty</strong>...<br />
rang<strong>in</strong>g from 1.2 to 1.8 times <strong>the</strong> <strong>poverty</strong> l<strong>in</strong>e; <strong>and</strong> (iv) those considered not vulnerable to <strong>poverty</strong>, who earn more<br />
than 1.8 times <strong>the</strong> <strong>poverty</strong> l<strong>in</strong>e.<br />
<strong>The</strong> vulnerable sectors suffer from shortcom<strong>in</strong>gs <strong>in</strong> a long list <strong>of</strong> areas: unemployment <strong>in</strong>surance, monetary sav<strong>in</strong>gs,<br />
health <strong>in</strong>surance, adequate pensions or retirement plans, private <strong>in</strong>surance <strong>for</strong> various eventualities <strong>and</strong>, <strong>in</strong> many<br />
cases, <strong>the</strong>ir own homes. <strong>The</strong>y also generally report high numbers <strong>of</strong> dependants <strong>and</strong> are unable to secure access to<br />
quality employment with <strong>social</strong> protection. For that reason, anti-<strong>poverty</strong> <strong>policies</strong> must not only help people escape<br />
from <strong>poverty</strong>, but also keep <strong>the</strong>m from slipp<strong>in</strong>g back <strong>in</strong>to it.<br />
<strong>The</strong> region’s data testify to <strong>the</strong> magnitude <strong>of</strong> <strong>the</strong> problem: <strong>the</strong> exposure <strong>of</strong> large sectors <strong>of</strong> Lat<strong>in</strong> <strong>America</strong>’s population<br />
to <strong>the</strong> risk <strong>of</strong> return<strong>in</strong>g to situations <strong>of</strong> <strong>poverty</strong> or extreme <strong>poverty</strong>, <strong>in</strong> a context <strong>of</strong> lower economic growth, slower job<br />
creation, <strong>in</strong>creased levels <strong>of</strong> unemployment <strong>and</strong> <strong>in</strong><strong>for</strong>mal work, <strong>and</strong> obstacles to <strong>the</strong> expansion <strong>of</strong> <strong>social</strong> spend<strong>in</strong>g.<br />
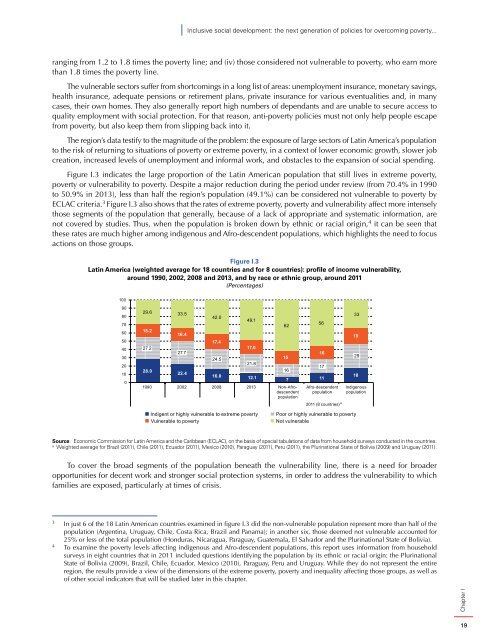
Figure I.3 <strong>in</strong>dicates <strong>the</strong> large proportion <strong>of</strong> <strong>the</strong> Lat<strong>in</strong> <strong>America</strong>n population that still lives <strong>in</strong> extreme <strong>poverty</strong>,<br />
<strong>poverty</strong> or vulnerability to <strong>poverty</strong>. Despite a major reduction dur<strong>in</strong>g <strong>the</strong> period under review (from 70.4% <strong>in</strong> 1990<br />
to 50.9% <strong>in</strong> 2013), less than half <strong>the</strong> region’s population (49.1%) can be considered not vulnerable to <strong>poverty</strong> by<br />
ECLAC criteria. 3 Figure I.3 also shows that <strong>the</strong> rates <strong>of</strong> extreme <strong>poverty</strong>, <strong>poverty</strong> <strong>and</strong> vulnerability affect more <strong>in</strong>tensely<br />
those segments <strong>of</strong> <strong>the</strong> population that generally, because <strong>of</strong> a lack <strong>of</strong> appropriate <strong>and</strong> systematic <strong>in</strong><strong>for</strong>mation, are<br />
not covered by studies. Thus, when <strong>the</strong> population is broken down by ethnic or racial orig<strong>in</strong>, 4 it can be seen that<br />
<strong>the</strong>se rates are much higher among <strong>in</strong>digenous <strong>and</strong> Afro-descendent populations, which highlights <strong>the</strong> need to focus<br />
actions on those groups.<br />
Figure I.3<br />
Lat<strong>in</strong> <strong>America</strong> (weighted average <strong>for</strong> 18 countries <strong>and</strong> <strong>for</strong> 8 countries): pr<strong>of</strong>ile <strong>of</strong> <strong>in</strong>come vulnerability,<br />
around 1990, 2002, 2008 <strong>and</strong> 2013, <strong>and</strong> by race or ethnic group, around 2011<br />
(Percentages)<br />
100<br />
90<br />
80<br />
70<br />
60<br />
50<br />
40<br />
30<br />
20<br />
10<br />
0<br />
29.6 33.5<br />
15.2<br />
27.2<br />
28.0<br />
16.4<br />
27.7<br />
22.4<br />
42.0<br />
17.4<br />
24.5<br />
49.1<br />
17.0<br />
21.8<br />
16.0 12.1<br />
1990 2002 2008 2013 Non-Afrodescendent<br />
population<br />
62<br />
15<br />
16<br />
56<br />
16<br />
17<br />
7 11<br />
Afro-descendent<br />
population<br />
2011 (8 countries) a<br />
33<br />
19<br />
29<br />
18<br />
Indigenous<br />
population<br />
Indigent or highly vulnerable to extreme <strong>poverty</strong><br />
Vulnerable to <strong>poverty</strong><br />
Poor or highly vulnerable to <strong>poverty</strong><br />
Not vulnerable<br />
Source: Economic Commission <strong>for</strong> Lat<strong>in</strong> <strong>America</strong> <strong>and</strong> <strong>the</strong> <strong>Caribbean</strong> (ECLAC), on <strong>the</strong> basis <strong>of</strong> special tabulations <strong>of</strong> data from household surveys conducted <strong>in</strong> <strong>the</strong> countries.<br />
a<br />
Weighted average <strong>for</strong> Brazil (2011), Chile (2011), Ecuador (2011), Mexico (2010), Paraguay (2011), Peru (2011), <strong>the</strong> Plur<strong>in</strong>ational State <strong>of</strong> Bolivia (2009) <strong>and</strong> Uruguay (2011).<br />
To cover <strong>the</strong> broad segments <strong>of</strong> <strong>the</strong> population beneath <strong>the</strong> vulnerability l<strong>in</strong>e, <strong>the</strong>re is a need <strong>for</strong> broader<br />
opportunities <strong>for</strong> decent work <strong>and</strong> stronger <strong>social</strong> protection systems, <strong>in</strong> order to address <strong>the</strong> vulnerability to which<br />
families are exposed, particularly at times <strong>of</strong> crisis.<br />
3<br />
In just 6 <strong>of</strong> <strong>the</strong> 18 Lat<strong>in</strong> <strong>America</strong>n countries exam<strong>in</strong>ed <strong>in</strong> figure I.3 did <strong>the</strong> non-vulnerable population represent more than half <strong>of</strong> <strong>the</strong><br />
population (Argent<strong>in</strong>a, Uruguay, Chile, Costa Rica, Brazil <strong>and</strong> Panama); <strong>in</strong> ano<strong>the</strong>r six, those deemed not vulnerable accounted <strong>for</strong><br />
25% or less <strong>of</strong> <strong>the</strong> total population (Honduras, Nicaragua, Paraguay, Guatemala, El Salvador <strong>and</strong> <strong>the</strong> Plur<strong>in</strong>ational State <strong>of</strong> Bolivia).<br />
4<br />
To exam<strong>in</strong>e <strong>the</strong> <strong>poverty</strong> levels affect<strong>in</strong>g <strong>in</strong>digenous <strong>and</strong> Afro-descendent populations, this report uses <strong>in</strong><strong>for</strong>mation from household<br />
surveys <strong>in</strong> eight countries that <strong>in</strong> 2011 <strong>in</strong>cluded questions identify<strong>in</strong>g <strong>the</strong> population by its ethnic or racial orig<strong>in</strong>: <strong>the</strong> Plur<strong>in</strong>ational<br />
State <strong>of</strong> Bolivia (2009), Brazil, Chile, Ecuador, Mexico (2010), Paraguay, Peru <strong>and</strong> Uruguay. While <strong>the</strong>y do not represent <strong>the</strong> entire<br />
region, <strong>the</strong> results provide a view <strong>of</strong> <strong>the</strong> dimensions <strong>of</strong> <strong>the</strong> extreme <strong>poverty</strong>, <strong>poverty</strong> <strong>and</strong> <strong><strong>in</strong>equality</strong> affect<strong>in</strong>g those groups, as well as<br />
<strong>of</strong> o<strong>the</strong>r <strong>social</strong> <strong>in</strong>dicators that will be studied later <strong>in</strong> this chapter.<br />
Chapter I<br />
19


