

Inclusive social development: The next generation of policies for overcoming poverty and reducing inequality in Latin America and the Caribbean
The Latin American and Caribbean region has achieved notable social development in the past decade. However, much remains to be done. The persisting challenges of defeating poverty once and for all and significantly reducing inequality are not only ethical imperatives but also conditions for making progress toward sustainable development, consistently with the recently adopted 2030 Agenda for Sustainable Development. Although the global economy is more complex and uncertain now than in previous years, and prospects for the region are not —in the short term, at least— particularly bright, it is crucial to secure the progress made in social development in the past decade and lose no time in tackling unresolved issues in areas where progress has been insufficient.
The Latin American and Caribbean region has achieved notable social development in the past decade. However, much remains to be done. The persisting challenges of defeating poverty once and for all and significantly reducing inequality are not only ethical imperatives but also conditions for making progress toward sustainable development, consistently with the recently adopted 2030 Agenda for Sustainable Development.
Although the global economy is more complex and uncertain now than in previous years, and prospects for the region are not —in the short term, at least— particularly bright, it is crucial to secure the progress made in social development in the past decade and lose no time in tackling unresolved issues in areas where progress has been insufficient.

You also want an ePaper? Increase the reach of your titles
YUMPU automatically turns print PDFs into web optimized ePapers that Google loves.
<strong>Inclusive</strong> <strong>social</strong> <strong>development</strong>: <strong>the</strong> <strong>next</strong> <strong>generation</strong> <strong>of</strong> <strong>policies</strong> <strong>for</strong> <strong>overcom<strong>in</strong>g</strong> <strong>poverty</strong>...<br />
Economic <strong>and</strong> <strong>social</strong> <strong>development</strong> analyses conducted by ECLAC have determ<strong>in</strong>ed that <strong>the</strong> economies <strong>of</strong> Lat<strong>in</strong><br />
<strong>America</strong> <strong>and</strong> <strong>the</strong> <strong>Caribbean</strong> have historically been def<strong>in</strong>ed by a pronounced structural heterogeneity, which makes<br />
a significant contribution to <strong>social</strong> <strong><strong>in</strong>equality</strong> <strong>in</strong> <strong>the</strong> region’s countries.<br />
As long ago as <strong>the</strong> 1960s <strong>and</strong> 1970s, those analyses revealed pronounced differences <strong>in</strong> productivity between<br />
<strong>and</strong> with<strong>in</strong> different productive strata <strong>and</strong> sectors (P<strong>in</strong>to, 1965 <strong>and</strong> 1975). Four decades later, while some features<br />
have changed, <strong>the</strong> evidence confirms that phenomenon (ECLAC, 2012b): <strong>the</strong> region’s economic structure is still<br />
characterized by a high level <strong>of</strong> heterogeneity, which can be analysed by exam<strong>in</strong><strong>in</strong>g three strata <strong>in</strong> terms <strong>of</strong> company<br />
size, productivity <strong>and</strong> access to technology <strong>and</strong> markets. <strong>The</strong> high stratum —where productivity per worker is similar<br />
to <strong>the</strong> averages found <strong>in</strong> developed economies <strong>and</strong> which is characterized by greater <strong>in</strong>tensity <strong>in</strong> <strong>the</strong> use <strong>of</strong> capital<br />
<strong>and</strong> technology <strong>and</strong> by more <strong>for</strong>malized labour relations— accounts <strong>for</strong> 66.9% <strong>of</strong> GDP <strong>and</strong> only 19.8% <strong>of</strong> total<br />
employment. <strong>The</strong> middle stratum, which is one step down <strong>in</strong> terms <strong>of</strong> technical advances, generates 22.5% <strong>of</strong> GDP <strong>and</strong><br />
employs 30% <strong>of</strong> <strong>the</strong> workers. F<strong>in</strong>ally, <strong>the</strong> low stratum, with a m<strong>in</strong>imal density <strong>of</strong> capital <strong>and</strong> out-<strong>of</strong>-date technologies,<br />
accounts <strong>for</strong> 50.2% <strong>of</strong> employment <strong>and</strong> contributes only 10.6% <strong>of</strong> GDP (ECLAC, 2012b).<br />
This unequal distribution <strong>of</strong> <strong>the</strong> labour <strong>for</strong>ce among productive strata is due to <strong>the</strong> low capacity <strong>of</strong> <strong>the</strong> more<br />
modern, advanced sectors to absorb workers. <strong>The</strong> pronounced disparity between each sector’s contributions to GDP<br />
<strong>and</strong> to employment has one ma<strong>in</strong> consequence: a highly unequal distribution <strong>of</strong> productivity, which, <strong>in</strong> <strong>the</strong> f<strong>in</strong>al<br />
analysis, leaves room <strong>for</strong> an extremely unequal appropriation <strong>of</strong> ga<strong>in</strong>s among workers (ECLAC, 2012b).<br />
In this way, <strong>the</strong> heterogeneity <strong>of</strong> <strong>the</strong> production structure is replicated <strong>in</strong> <strong>the</strong> labour market <strong>and</strong>, from <strong>the</strong>re,<br />
transmitted throughout society. Productivity gaps both reflect <strong>and</strong> re<strong>in</strong><strong>for</strong>ce gaps <strong>in</strong> capacities, <strong>in</strong> job quality <strong>and</strong><br />
<strong>in</strong>come, <strong>in</strong> barga<strong>in</strong><strong>in</strong>g power, <strong>in</strong> access to <strong>social</strong> protection systems <strong>and</strong> <strong>in</strong> opportunities <strong>for</strong> occupational upward<br />
mobility <strong>in</strong> <strong>the</strong> course <strong>of</strong> one’s work<strong>in</strong>g life. This leads to vicious cycles not only <strong>of</strong> <strong>poverty</strong>, <strong><strong>in</strong>equality</strong> <strong>and</strong> slow<br />
growth, but also slow learn<strong>in</strong>g <strong>and</strong> structural change (ECLAC, 2010b).<br />
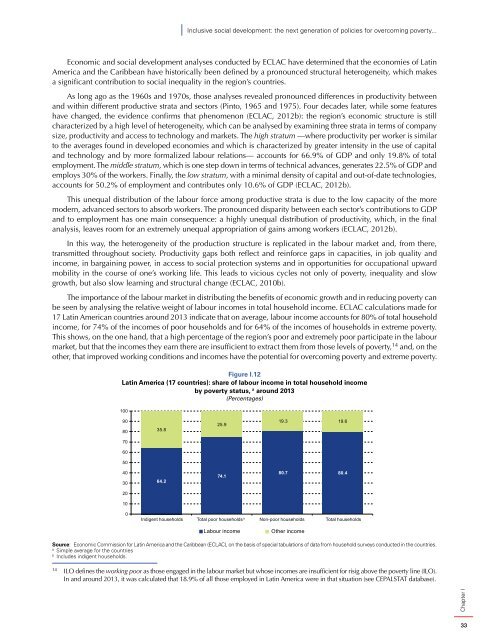
<strong>The</strong> importance <strong>of</strong> <strong>the</strong> labour market <strong>in</strong> distribut<strong>in</strong>g <strong>the</strong> benefits <strong>of</strong> economic growth <strong>and</strong> <strong>in</strong> <strong>reduc<strong>in</strong>g</strong> <strong>poverty</strong> can<br />
be seen by analys<strong>in</strong>g <strong>the</strong> relative weight <strong>of</strong> labour <strong>in</strong>comes <strong>in</strong> total household <strong>in</strong>come. ECLAC calculations made <strong>for</strong><br />
17 Lat<strong>in</strong> <strong>America</strong>n countries around 2013 <strong>in</strong>dicate that on average, labour <strong>in</strong>come accounts <strong>for</strong> 80% <strong>of</strong> total household<br />
<strong>in</strong>come, <strong>for</strong> 74% <strong>of</strong> <strong>the</strong> <strong>in</strong>comes <strong>of</strong> poor households <strong>and</strong> <strong>for</strong> 64% <strong>of</strong> <strong>the</strong> <strong>in</strong>comes <strong>of</strong> households <strong>in</strong> extreme <strong>poverty</strong>.<br />
This shows, on <strong>the</strong> one h<strong>and</strong>, that a high percentage <strong>of</strong> <strong>the</strong> region’s poor <strong>and</strong> extremely poor participate <strong>in</strong> <strong>the</strong> labour<br />
market, but that <strong>the</strong> <strong>in</strong>comes <strong>the</strong>y earn <strong>the</strong>re are <strong>in</strong>sufficient to extract <strong>the</strong>m from those levels <strong>of</strong> <strong>poverty</strong>, 14 <strong>and</strong>, on <strong>the</strong><br />
o<strong>the</strong>r, that improved work<strong>in</strong>g conditions <strong>and</strong> <strong>in</strong>comes have <strong>the</strong> potential <strong>for</strong> <strong>overcom<strong>in</strong>g</strong> <strong>poverty</strong> <strong>and</strong> extreme <strong>poverty</strong>.<br />
Figure I.12<br />
Lat<strong>in</strong> <strong>America</strong> (17 countries): share <strong>of</strong> labour <strong>in</strong>come <strong>in</strong> total household <strong>in</strong>come<br />
by <strong>poverty</strong> status, a around 2013<br />
(Percentages)<br />
100<br />
90<br />
80<br />
35.8<br />
25.9<br />
19.3 19.6<br />
70<br />
60<br />
50<br />
40<br />
30<br />
64.2<br />
74.1<br />
80.7 80.4<br />
20<br />
10<br />
0<br />
Indigent households Total poor households b Non-poor households Total households<br />
Labour <strong>in</strong>come<br />
O<strong>the</strong>r <strong>in</strong>come<br />
Source: Economic Commission <strong>for</strong> Lat<strong>in</strong> <strong>America</strong> <strong>and</strong> <strong>the</strong> <strong>Caribbean</strong> (ECLAC), on <strong>the</strong> basis <strong>of</strong> special tabulations <strong>of</strong> data from household surveys conducted <strong>in</strong> <strong>the</strong> countries.<br />
a<br />
Simple average <strong>for</strong> <strong>the</strong> countries<br />
b<br />
Includes <strong>in</strong>digent households.<br />
14<br />
ILO def<strong>in</strong>es <strong>the</strong> work<strong>in</strong>g poor as those engaged <strong>in</strong> <strong>the</strong> labour market but whose <strong>in</strong>comes are <strong>in</strong>sufficient <strong>for</strong> risig above <strong>the</strong> <strong>poverty</strong> l<strong>in</strong>e (ILO).<br />
In <strong>and</strong> around 2013, it was calculated that 18.9% <strong>of</strong> all those employed <strong>in</strong> Lat<strong>in</strong> <strong>America</strong> were <strong>in</strong> that situation (see CEPALSTAT database).<br />
Chapter I<br />
33


