

Inclusive social development: The next generation of policies for overcoming poverty and reducing inequality in Latin America and the Caribbean
The Latin American and Caribbean region has achieved notable social development in the past decade. However, much remains to be done. The persisting challenges of defeating poverty once and for all and significantly reducing inequality are not only ethical imperatives but also conditions for making progress toward sustainable development, consistently with the recently adopted 2030 Agenda for Sustainable Development. Although the global economy is more complex and uncertain now than in previous years, and prospects for the region are not —in the short term, at least— particularly bright, it is crucial to secure the progress made in social development in the past decade and lose no time in tackling unresolved issues in areas where progress has been insufficient.
The Latin American and Caribbean region has achieved notable social development in the past decade. However, much remains to be done. The persisting challenges of defeating poverty once and for all and significantly reducing inequality are not only ethical imperatives but also conditions for making progress toward sustainable development, consistently with the recently adopted 2030 Agenda for Sustainable Development.
Although the global economy is more complex and uncertain now than in previous years, and prospects for the region are not —in the short term, at least— particularly bright, it is crucial to secure the progress made in social development in the past decade and lose no time in tackling unresolved issues in areas where progress has been insufficient.

Create successful ePaper yourself
Turn your PDF publications into a flip-book with our unique Google optimized e-Paper software.
<strong>Inclusive</strong> <strong>social</strong> <strong>development</strong>: <strong>the</strong> <strong>next</strong> <strong>generation</strong> <strong>of</strong> <strong>policies</strong> <strong>for</strong> <strong>overcom<strong>in</strong>g</strong> <strong>poverty</strong>...<br />
Gender <strong>in</strong>equalities <strong>and</strong> ethnic <strong>and</strong> racial <strong>in</strong>equalities <strong>in</strong>tersect<br />
<strong>and</strong> re<strong>in</strong><strong>for</strong>ce each o<strong>the</strong>r, <strong>and</strong> this can be seen <strong>in</strong> <strong>the</strong> situations <strong>of</strong><br />
particular disadvantage faced by <strong>in</strong>digenous women <strong>and</strong> women<br />
<strong>of</strong> African descent <strong>in</strong> various areas, compared both to <strong>the</strong>ir male<br />
peers <strong>and</strong> to non-<strong>in</strong>digenous, non-Afro-descendent women.<br />
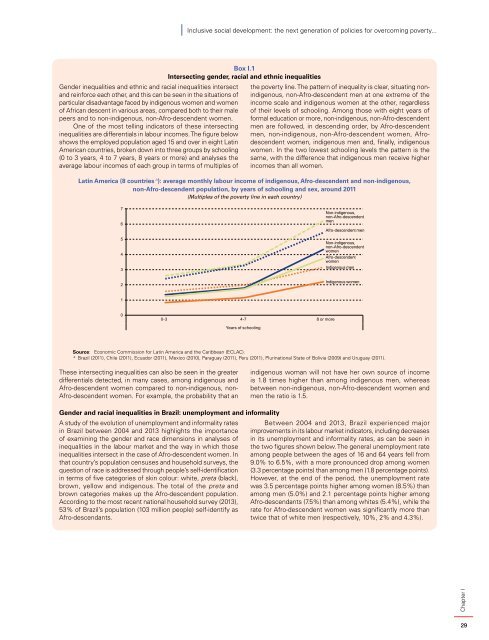
One <strong>of</strong> <strong>the</strong> most tell<strong>in</strong>g <strong>in</strong>dicators <strong>of</strong> <strong>the</strong>se <strong>in</strong>tersect<strong>in</strong>g<br />
<strong>in</strong>equalities are differentials <strong>in</strong> labour <strong>in</strong>comes. <strong>The</strong> figure below<br />
shows <strong>the</strong> employed population aged 15 <strong>and</strong> over <strong>in</strong> eight Lat<strong>in</strong><br />
<strong>America</strong>n countries, broken down <strong>in</strong>to three groups by school<strong>in</strong>g<br />
(0 to 3 years, 4 to 7 years, 8 years or more) <strong>and</strong> analyses <strong>the</strong><br />
average labour <strong>in</strong>comes <strong>of</strong> each group <strong>in</strong> terms <strong>of</strong> multiples <strong>of</strong><br />
Box I.1<br />
Intersect<strong>in</strong>g gender, racial <strong>and</strong> ethnic <strong>in</strong>equalities<br />
<strong>the</strong> <strong>poverty</strong> l<strong>in</strong>e. <strong>The</strong> pattern <strong>of</strong> <strong><strong>in</strong>equality</strong> is clear, situat<strong>in</strong>g non<strong>in</strong>digenous,<br />
non-Afro-descendent men at one extreme <strong>of</strong> <strong>the</strong><br />
<strong>in</strong>come scale <strong>and</strong> <strong>in</strong>digenous women at <strong>the</strong> o<strong>the</strong>r, regardless<br />
<strong>of</strong> <strong>the</strong>ir levels <strong>of</strong> school<strong>in</strong>g. Among those with eight years <strong>of</strong><br />
<strong>for</strong>mal education or more, non-<strong>in</strong>digenous, non-Afro-descendent<br />
men are followed, <strong>in</strong> descend<strong>in</strong>g order, by Afro-descendent<br />
men, non-<strong>in</strong>digenous, non-Afro-descendent women, Afrodescendent<br />
women, <strong>in</strong>digenous men <strong>and</strong>, f<strong>in</strong>ally, <strong>in</strong>digenous<br />
women. In <strong>the</strong> two lowest school<strong>in</strong>g levels <strong>the</strong> pattern is <strong>the</strong><br />
same, with <strong>the</strong> difference that <strong>in</strong>digenous men receive higher<br />
<strong>in</strong>comes than all women.<br />
Lat<strong>in</strong> <strong>America</strong> (8 countries a ): average monthly labour <strong>in</strong>come <strong>of</strong> <strong>in</strong>digenous, Afro-descendent <strong>and</strong> non-<strong>in</strong>digenous,<br />
non-Afro-descendent population, by years <strong>of</strong> school<strong>in</strong>g <strong>and</strong> sex, around 2011<br />
(Multiples <strong>of</strong> <strong>the</strong> <strong>poverty</strong> l<strong>in</strong>e <strong>in</strong> each country)<br />
7<br />
6<br />
5<br />
4<br />
3<br />
Non-<strong>in</strong>digenous,<br />
non-Afro-descendent<br />
men<br />
Afro-descendent men<br />
Non-<strong>in</strong>digenous,<br />
non-Afro-descendent<br />
women<br />
Afro-descendent<br />
women<br />
Indigenous men<br />
2<br />
Indigenous women<br />
1<br />
0<br />
0-3 4-7 8 or more<br />
Years <strong>of</strong> school<strong>in</strong>g<br />
Source: Economic Commission <strong>for</strong> Lat<strong>in</strong> <strong>America</strong> <strong>and</strong> <strong>the</strong> <strong>Caribbean</strong> (ECLAC).<br />
a Brazil (2011), Chile (2011), Ecuador (2011), Mexico (2010), Paraguay (2011), Peru (2011), Plur<strong>in</strong>ational State <strong>of</strong> Bolivia (2009) <strong>and</strong> Uruguay (2011).<br />
<strong>The</strong>se <strong>in</strong>tersect<strong>in</strong>g <strong>in</strong>equalities can also be seen <strong>in</strong> <strong>the</strong> greater<br />
differentials detected, <strong>in</strong> many cases, among <strong>in</strong>digenous <strong>and</strong><br />
Afro-descendent women compared to non-<strong>in</strong>digenous, non-<br />
Afro-descendent women. For example, <strong>the</strong> probability that an<br />
<strong>in</strong>digenous woman will not have her own source <strong>of</strong> <strong>in</strong>come<br />
is 1.8 times higher than among <strong>in</strong>digenous men, whereas<br />
between non-<strong>in</strong>digenous, non-Afro-descendent women <strong>and</strong><br />
men <strong>the</strong> ratio is 1.5.<br />
Gender <strong>and</strong> racial <strong>in</strong>equalities <strong>in</strong> Brazil: unemployment <strong>and</strong> <strong>in</strong><strong>for</strong>mality<br />
A study <strong>of</strong> <strong>the</strong> evolution <strong>of</strong> unemployment <strong>and</strong> <strong>in</strong><strong>for</strong>mality rates<br />
<strong>in</strong> Brazil between 2004 <strong>and</strong> 2013 highlights <strong>the</strong> importance<br />
<strong>of</strong> exam<strong>in</strong><strong>in</strong>g <strong>the</strong> gender <strong>and</strong> race dimensions <strong>in</strong> analyses <strong>of</strong><br />
<strong>in</strong>equalities <strong>in</strong> <strong>the</strong> labour market <strong>and</strong> <strong>the</strong> way <strong>in</strong> which those<br />
<strong>in</strong>equalities <strong>in</strong>tersect <strong>in</strong> <strong>the</strong> case <strong>of</strong> Afro-descendent women. In<br />
that country’s population censuses <strong>and</strong> household surveys, <strong>the</strong><br />
question <strong>of</strong> race is addressed through people’s self-identification<br />
<strong>in</strong> terms <strong>of</strong> five categories <strong>of</strong> sk<strong>in</strong> colour: white, preta (black),<br />
brown, yellow <strong>and</strong> <strong>in</strong>digenous. <strong>The</strong> total <strong>of</strong> <strong>the</strong> preta <strong>and</strong><br />
brown categories makes up <strong>the</strong> Afro-descendent population.<br />
Accord<strong>in</strong>g to <strong>the</strong> most recent national household survey (2013),<br />
53% <strong>of</strong> Brazil’s population (103 million people) self-identify as<br />
Afro-descendants.<br />
Between 2004 <strong>and</strong> 2013, Brazil experienced major<br />
improvements <strong>in</strong> its labour market <strong>in</strong>dicators, <strong>in</strong>clud<strong>in</strong>g decreases<br />
<strong>in</strong> its unemployment <strong>and</strong> <strong>in</strong><strong>for</strong>mality rates, as can be seen <strong>in</strong><br />
<strong>the</strong> two figures shown below. <strong>The</strong> general unemployment rate<br />
among people between <strong>the</strong> ages <strong>of</strong> 16 <strong>and</strong> 64 years fell from<br />
9.0% to 6.5%, with a more pronounced drop among women<br />
(3.3 percentage po<strong>in</strong>ts) than among men (1.8 percentage po<strong>in</strong>ts).<br />
However, at <strong>the</strong> end <strong>of</strong> <strong>the</strong> period, <strong>the</strong> unemployment rate<br />
was 3.5 percentage po<strong>in</strong>ts higher among women (8.5%) than<br />
among men (5.0%) <strong>and</strong> 2.1 percentage po<strong>in</strong>ts higher among<br />
Afro-descendants (7.5%) than among whites (5.4%), while <strong>the</strong><br />
rate <strong>for</strong> Afro-descendent women was significantly more than<br />
twice that <strong>of</strong> white men (respectively, 10%, 2% <strong>and</strong> 4.3%).<br />
Chapter I<br />
29


