

Inclusive social development: The next generation of policies for overcoming poverty and reducing inequality in Latin America and the Caribbean
The Latin American and Caribbean region has achieved notable social development in the past decade. However, much remains to be done. The persisting challenges of defeating poverty once and for all and significantly reducing inequality are not only ethical imperatives but also conditions for making progress toward sustainable development, consistently with the recently adopted 2030 Agenda for Sustainable Development. Although the global economy is more complex and uncertain now than in previous years, and prospects for the region are not —in the short term, at least— particularly bright, it is crucial to secure the progress made in social development in the past decade and lose no time in tackling unresolved issues in areas where progress has been insufficient.
The Latin American and Caribbean region has achieved notable social development in the past decade. However, much remains to be done. The persisting challenges of defeating poverty once and for all and significantly reducing inequality are not only ethical imperatives but also conditions for making progress toward sustainable development, consistently with the recently adopted 2030 Agenda for Sustainable Development.
Although the global economy is more complex and uncertain now than in previous years, and prospects for the region are not —in the short term, at least— particularly bright, it is crucial to secure the progress made in social development in the past decade and lose no time in tackling unresolved issues in areas where progress has been insufficient.

Create successful ePaper yourself
Turn your PDF publications into a flip-book with our unique Google optimized e-Paper software.
<strong>Inclusive</strong> <strong>social</strong> <strong>development</strong>: <strong>the</strong> <strong>next</strong> <strong>generation</strong> <strong>of</strong> <strong>policies</strong> <strong>for</strong> <strong>overcom<strong>in</strong>g</strong> <strong>poverty</strong>...<br />
Also dur<strong>in</strong>g <strong>the</strong> 1990s, <strong>the</strong>re was a significant <strong>in</strong>crease <strong>in</strong> labour <strong>for</strong>ce participation rates, caused by <strong>the</strong> large<br />
<strong>in</strong>crease <strong>in</strong> <strong>the</strong> numbers <strong>of</strong> women <strong>in</strong> <strong>the</strong> work<strong>for</strong>ce (from 41% <strong>in</strong> 1990 to 50% <strong>in</strong> 2002) <strong>and</strong>, to a lesser extent,<br />
<strong>of</strong> young people (from 53% to 56% over <strong>the</strong> same period); this can be seen <strong>in</strong> figure 1.13.B. This <strong>in</strong>crease <strong>in</strong> <strong>the</strong><br />
work<strong>for</strong>ce far outstripped <strong>the</strong> economies’ capacity to create jobs; as a result, <strong>in</strong> spite <strong>of</strong> <strong>the</strong> cycles <strong>of</strong> clear economic<br />
expansion, unemployment rates cont<strong>in</strong>ued to <strong>in</strong>crease or failed to report significant reductions. Unemployment rose<br />
much more sharply among young people, with <strong>the</strong> rate tripl<strong>in</strong>g <strong>the</strong> rate <strong>for</strong> mature adults, <strong>in</strong> a context <strong>in</strong> which wage<br />
levels were decl<strong>in</strong><strong>in</strong>g <strong>in</strong> relative terms (ECLAC/OIJ, 2004).<br />
<strong>The</strong> same period also saw <strong>in</strong>creased job creation <strong>in</strong> low-productivity sectors <strong>and</strong> <strong>the</strong> new jobs created, particularly<br />
<strong>the</strong> worst quality ones, were largely concentrated <strong>in</strong> <strong>the</strong> services sector. One <strong>of</strong> <strong>the</strong> consequences <strong>of</strong> <strong>the</strong> general eas<strong>in</strong>g<br />
<strong>of</strong> labour market conditions was <strong>in</strong>creased precariousness <strong>in</strong> employment <strong>and</strong> greater <strong>in</strong><strong>for</strong>mality.<br />
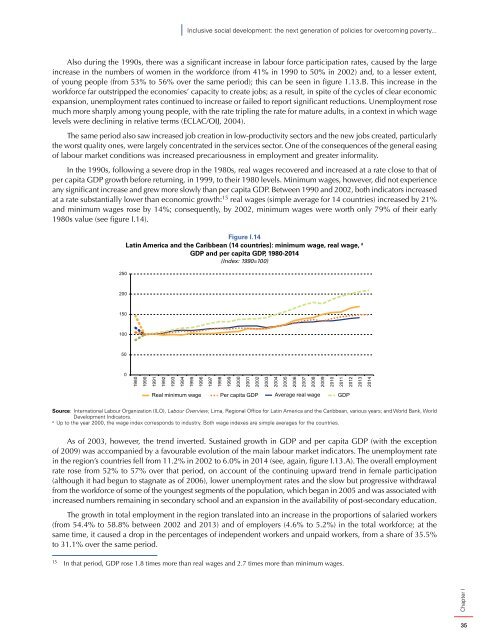
In <strong>the</strong> 1990s, follow<strong>in</strong>g a severe drop <strong>in</strong> <strong>the</strong> 1980s, real wages recovered <strong>and</strong> <strong>in</strong>creased at a rate close to that <strong>of</strong><br />
per capita GDP growth be<strong>for</strong>e return<strong>in</strong>g, <strong>in</strong> 1999, to <strong>the</strong>ir 1980 levels. M<strong>in</strong>imum wages, however, did not experience<br />
any significant <strong>in</strong>crease <strong>and</strong> grew more slowly than per capita GDP. Between 1990 <strong>and</strong> 2002, both <strong>in</strong>dicators <strong>in</strong>creased<br />
at a rate substantially lower than economic growth: 15 real wages (simple average <strong>for</strong> 14 countries) <strong>in</strong>creased by 21%<br />
<strong>and</strong> m<strong>in</strong>imum wages rose by 14%; consequently, by 2002, m<strong>in</strong>imum wages were worth only 79% <strong>of</strong> <strong>the</strong>ir early<br />
1980s value (see figure I.14).<br />
250<br />
Figure I.14<br />
Lat<strong>in</strong> <strong>America</strong> <strong>and</strong> <strong>the</strong> <strong>Caribbean</strong> (14 countries): m<strong>in</strong>imum wage, real wage, a<br />
GDP <strong>and</strong> per capita GDP, 1980-2014<br />
(Index: 1990=100)<br />
200<br />
150<br />
100<br />
50<br />
0<br />
Chapter I<br />
1980<br />
1990<br />
1991<br />
1992<br />
1993<br />
1994<br />
1995<br />
1996<br />
1997<br />
1998<br />
1999<br />
2000<br />
2001<br />
2002<br />
2003<br />
2004<br />
2005<br />
2006<br />
2007<br />
2008<br />
2009<br />
2010<br />
2011<br />
2012<br />
2013<br />
2014<br />
Real m<strong>in</strong>imum wage<br />
Per capita GDP<br />
Average real wage<br />
GDP<br />
Source: International Labour Organization (ILO), Labour Overview, Lima, Regional Office <strong>for</strong> Lat<strong>in</strong> <strong>America</strong> <strong>and</strong> <strong>the</strong> <strong>Caribbean</strong>, various years; <strong>and</strong> World Bank, World<br />
Development Indicators.<br />
a<br />
Up to <strong>the</strong> year 2000, <strong>the</strong> wage <strong>in</strong>dex corresponds to <strong>in</strong>dustry. Both wage <strong>in</strong>dexes are simple averages <strong>for</strong> <strong>the</strong> countries.<br />
As <strong>of</strong> 2003, however, <strong>the</strong> trend <strong>in</strong>verted. Susta<strong>in</strong>ed growth <strong>in</strong> GDP <strong>and</strong> per capita GDP (with <strong>the</strong> exception<br />
<strong>of</strong> 2009) was accompanied by a favourable evolution <strong>of</strong> <strong>the</strong> ma<strong>in</strong> labour market <strong>in</strong>dicators. <strong>The</strong> unemployment rate<br />
<strong>in</strong> <strong>the</strong> region’s countries fell from 11.2% <strong>in</strong> 2002 to 6.0% <strong>in</strong> 2014 (see, aga<strong>in</strong>, figure I.13.A). <strong>The</strong> overall employment<br />
rate rose from 52% to 57% over that period, on account <strong>of</strong> <strong>the</strong> cont<strong>in</strong>u<strong>in</strong>g upward trend <strong>in</strong> female participation<br />
(although it had begun to stagnate as <strong>of</strong> 2006), lower unemployment rates <strong>and</strong> <strong>the</strong> slow but progressive withdrawal<br />
from <strong>the</strong> work<strong>for</strong>ce <strong>of</strong> some <strong>of</strong> <strong>the</strong> youngest segments <strong>of</strong> <strong>the</strong> population, which began <strong>in</strong> 2005 <strong>and</strong> was associated with<br />
<strong>in</strong>creased numbers rema<strong>in</strong><strong>in</strong>g <strong>in</strong> secondary school <strong>and</strong> an expansion <strong>in</strong> <strong>the</strong> availability <strong>of</strong> post-secondary education.<br />
<strong>The</strong> growth <strong>in</strong> total employment <strong>in</strong> <strong>the</strong> region translated <strong>in</strong>to an <strong>in</strong>crease <strong>in</strong> <strong>the</strong> proportions <strong>of</strong> salaried workers<br />
(from 54.4% to 58.8% between 2002 <strong>and</strong> 2013) <strong>and</strong> <strong>of</strong> employers (4.6% to 5.2%) <strong>in</strong> <strong>the</strong> total work<strong>for</strong>ce; at <strong>the</strong><br />
same time, it caused a drop <strong>in</strong> <strong>the</strong> percentages <strong>of</strong> <strong>in</strong>dependent workers <strong>and</strong> unpaid workers, from a share <strong>of</strong> 35.5%<br />
to 31.1% over <strong>the</strong> same period.<br />
15<br />
In that period, GDP rose 1.8 times more than real wages <strong>and</strong> 2.7 times more than m<strong>in</strong>imum wages.<br />
35


