

Inclusive social development: The next generation of policies for overcoming poverty and reducing inequality in Latin America and the Caribbean
The Latin American and Caribbean region has achieved notable social development in the past decade. However, much remains to be done. The persisting challenges of defeating poverty once and for all and significantly reducing inequality are not only ethical imperatives but also conditions for making progress toward sustainable development, consistently with the recently adopted 2030 Agenda for Sustainable Development. Although the global economy is more complex and uncertain now than in previous years, and prospects for the region are not —in the short term, at least— particularly bright, it is crucial to secure the progress made in social development in the past decade and lose no time in tackling unresolved issues in areas where progress has been insufficient.
The Latin American and Caribbean region has achieved notable social development in the past decade. However, much remains to be done. The persisting challenges of defeating poverty once and for all and significantly reducing inequality are not only ethical imperatives but also conditions for making progress toward sustainable development, consistently with the recently adopted 2030 Agenda for Sustainable Development.
Although the global economy is more complex and uncertain now than in previous years, and prospects for the region are not —in the short term, at least— particularly bright, it is crucial to secure the progress made in social development in the past decade and lose no time in tackling unresolved issues in areas where progress has been insufficient.

You also want an ePaper? Increase the reach of your titles
YUMPU automatically turns print PDFs into web optimized ePapers that Google loves.
<strong>Inclusive</strong> <strong>social</strong> <strong>development</strong>: <strong>the</strong> <strong>next</strong> <strong>generation</strong> <strong>of</strong> <strong>policies</strong> <strong>for</strong> <strong>overcom<strong>in</strong>g</strong> <strong>poverty</strong>...<br />
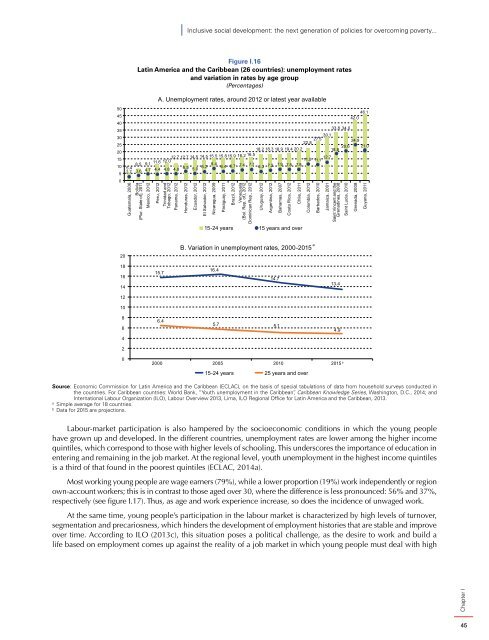
Figure I.16<br />
Lat<strong>in</strong> <strong>America</strong> <strong>and</strong> <strong>the</strong> <strong>Caribbean</strong> (26 countries): unemployment rates<br />
<strong>and</strong> variation <strong>in</strong> rates by age group<br />
(Percentages)<br />
A. Unemployment rates, around 2012 or latest year available<br />
50<br />
45<br />
40<br />
35<br />
30<br />
25<br />
20<br />
15<br />
10<br />
5<br />
0<br />
46.1<br />
42.0<br />
33.8 34.0<br />
22.8 27.5 30.1 24.9<br />
18.2 18.3 18.9 19.4 20.2<br />
18.8 20.6 21.0<br />
5.4 8.5 9.1 11.6 12.0 12.7 12.7 14.5 14.5 15.5 15.8 15.9 16.2 16.5 11.5<br />
2.7 3.6 4.7 4.4 4.8 4.8 6.5 5.0 6.2 8.4 11.1 12.7<br />
6.4 6.7 7.4 7.7 6.3 7.2 7.9 7.8 7.8<br />
Guatemala, 2006<br />
Bolivia<br />
(Plur. State <strong>of</strong>), 2011<br />
Mexico, 2012<br />
Peru, 2012<br />
Chapter I<br />
Tr<strong>in</strong>idad <strong>and</strong><br />
Tobago, 2012<br />
Panama, 2012<br />
Honduras, 2012<br />
Ecuador, 2012<br />
El Salvador, 2012<br />
Nicaragua, 2009<br />
Paraguay, 2011<br />
Brazil, 2012<br />
Venezuela<br />
(Bol. Rep. <strong>of</strong>), 2012<br />
Dom<strong>in</strong>ican Rep., 2012<br />
Uruguay, 2012<br />
Argent<strong>in</strong>a, 2012<br />
Bahamas, 2007<br />
Costa Rica, 2012<br />
Chile, 2011<br />
15-24 years 15 years <strong>and</strong> over<br />
Colombia, 2012<br />
Barbados, 2010<br />
Jamaica, 2001<br />
Sa<strong>in</strong>t V<strong>in</strong>cent <strong>and</strong> <strong>the</strong><br />
Grenad<strong>in</strong>es, 2008<br />
Sa<strong>in</strong>t Lucia, 2010<br />
Grenada, 2008<br />
Guyana, 2011<br />
20<br />
B. Variation <strong>in</strong> unemployment rates, 2000-2015 a<br />
18<br />
16<br />
14<br />
15.7<br />
16.4<br />
14.7<br />
13.4<br />
12<br />
10<br />
8<br />
6<br />
6.4<br />
5.7 5.1<br />
4.9<br />
4<br />
2<br />
0<br />
2000 2005 2010 2015 b<br />
15-24 years 25 years <strong>and</strong> over<br />
Source: Economic Commission <strong>for</strong> Lat<strong>in</strong> <strong>America</strong> <strong>and</strong> <strong>the</strong> <strong>Caribbean</strong> (ECLAC), on <strong>the</strong> basis <strong>of</strong> special tabulations <strong>of</strong> data from household surveys conducted <strong>in</strong><br />
<strong>the</strong> countries. For <strong>Caribbean</strong> countries: World Bank, “Youth unemployment <strong>in</strong> <strong>the</strong> <strong>Caribbean</strong>”, <strong>Caribbean</strong> Knowledge Series, Wash<strong>in</strong>gton, D.C., 2014; <strong>and</strong><br />
International Labour Organization (ILO), Labour Overview 2013, Lima, ILO Regional Office <strong>for</strong> Lat<strong>in</strong> <strong>America</strong> <strong>and</strong> <strong>the</strong> <strong>Caribbean</strong>, 2013.<br />
a<br />
Simple average <strong>for</strong> 18 countries.<br />
b<br />
Data <strong>for</strong> 2015 are projections.<br />
Labour-market participation is also hampered by <strong>the</strong> socioeconomic conditions <strong>in</strong> which <strong>the</strong> young people<br />
have grown up <strong>and</strong> developed. In <strong>the</strong> different countries, unemployment rates are lower among <strong>the</strong> higher <strong>in</strong>come<br />
qu<strong>in</strong>tiles, which correspond to those with higher levels <strong>of</strong> school<strong>in</strong>g. This underscores <strong>the</strong> importance <strong>of</strong> education <strong>in</strong><br />
enter<strong>in</strong>g <strong>and</strong> rema<strong>in</strong><strong>in</strong>g <strong>in</strong> <strong>the</strong> job market. At <strong>the</strong> regional level, youth unemployment <strong>in</strong> <strong>the</strong> highest <strong>in</strong>come qu<strong>in</strong>tiles<br />
is a third <strong>of</strong> that found <strong>in</strong> <strong>the</strong> poorest qu<strong>in</strong>tiles (ECLAC, 2014a).<br />
Most work<strong>in</strong>g young people are wage earners (79%), while a lower proportion (19%) work <strong>in</strong>dependently or region<br />
own-account workers; this is <strong>in</strong> contrast to those aged over 30, where <strong>the</strong> difference is less pronounced: 56% <strong>and</strong> 37%,<br />
respectively (see figure I.17). Thus, as age <strong>and</strong> work experience <strong>in</strong>crease, so does <strong>the</strong> <strong>in</strong>cidence <strong>of</strong> unwaged work.<br />
At <strong>the</strong> same time, young people’s participation <strong>in</strong> <strong>the</strong> labour market is characterized by high levels <strong>of</strong> turnover,<br />
segmentation <strong>and</strong> precariosness, which h<strong>in</strong>ders <strong>the</strong> <strong>development</strong> <strong>of</strong> employment histories that are stable <strong>and</strong> improve<br />
over time. Accord<strong>in</strong>g to ILO (2013c), this situation poses a political challenge, as <strong>the</strong> desire to work <strong>and</strong> build a<br />
life based on employment comes up aga<strong>in</strong>st <strong>the</strong> reality <strong>of</strong> a job market <strong>in</strong> which young people must deal with high<br />
45


