

Inclusive social development: The next generation of policies for overcoming poverty and reducing inequality in Latin America and the Caribbean
The Latin American and Caribbean region has achieved notable social development in the past decade. However, much remains to be done. The persisting challenges of defeating poverty once and for all and significantly reducing inequality are not only ethical imperatives but also conditions for making progress toward sustainable development, consistently with the recently adopted 2030 Agenda for Sustainable Development. Although the global economy is more complex and uncertain now than in previous years, and prospects for the region are not —in the short term, at least— particularly bright, it is crucial to secure the progress made in social development in the past decade and lose no time in tackling unresolved issues in areas where progress has been insufficient.
The Latin American and Caribbean region has achieved notable social development in the past decade. However, much remains to be done. The persisting challenges of defeating poverty once and for all and significantly reducing inequality are not only ethical imperatives but also conditions for making progress toward sustainable development, consistently with the recently adopted 2030 Agenda for Sustainable Development.
Although the global economy is more complex and uncertain now than in previous years, and prospects for the region are not —in the short term, at least— particularly bright, it is crucial to secure the progress made in social development in the past decade and lose no time in tackling unresolved issues in areas where progress has been insufficient.

You also want an ePaper? Increase the reach of your titles
YUMPU automatically turns print PDFs into web optimized ePapers that Google loves.
<strong>Inclusive</strong> <strong>social</strong> <strong>development</strong>: <strong>the</strong> <strong>next</strong> <strong>generation</strong> <strong>of</strong> <strong>policies</strong> <strong>for</strong> <strong>overcom<strong>in</strong>g</strong> <strong>poverty</strong>...<br />
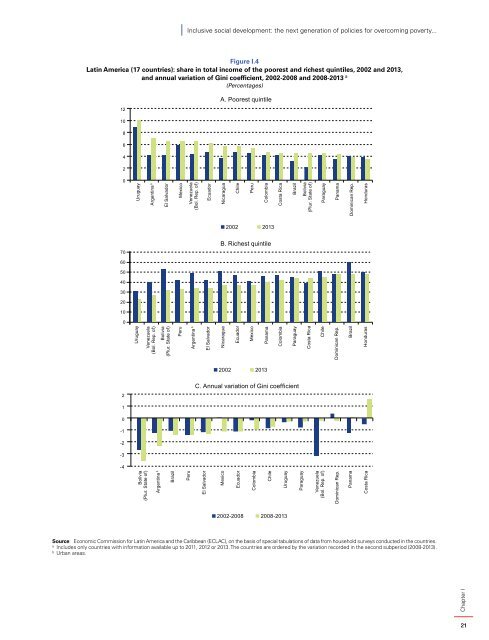
Figure I.4<br />
Lat<strong>in</strong> <strong>America</strong> (17 countries): share <strong>in</strong> total <strong>in</strong>come <strong>of</strong> <strong>the</strong> poorest <strong>and</strong> richest qu<strong>in</strong>tiles, 2002 <strong>and</strong> 2013,<br />
<strong>and</strong> annual variation <strong>of</strong> G<strong>in</strong>i coefficient, 2002-2008 <strong>and</strong> 2008-2013 a<br />
(Percentages)<br />
12<br />
10<br />
8<br />
6<br />
4<br />
2<br />
A. Poorest qu<strong>in</strong>tile<br />
0<br />
Uruguay<br />
Argent<strong>in</strong>a b<br />
Chapter I<br />
El Salvador<br />
Mexico<br />
Venezuela<br />
(Bol. Rep. <strong>of</strong>)<br />
Ecuador<br />
Nicaragua<br />
Chile<br />
Peru<br />
Colombia<br />
Costa Rica<br />
Brazil<br />
Bolivia<br />
(Plur. State <strong>of</strong>)<br />
Paraguay<br />
Panama<br />
Dom<strong>in</strong>ican Rep.<br />
Honduras<br />
2002 2013<br />
70<br />
B. Richest qu<strong>in</strong>tile<br />
60<br />
50<br />
40<br />
30<br />
20<br />
10<br />
0<br />
Uruguay<br />
Venezuela<br />
(Bol. Rep. <strong>of</strong>)<br />
Bolivia<br />
(Plur. State <strong>of</strong>)<br />
Peru<br />
Argent<strong>in</strong>a b<br />
El Salvador<br />
Nicaragua<br />
Ecuador<br />
Mexico<br />
Panama<br />
Colombia<br />
Paraguay<br />
Costa Rica<br />
Chile<br />
Dom<strong>in</strong>ican Rep.<br />
Brazil<br />
Honduras<br />
2002 2013<br />
2<br />
C. Annual variation <strong>of</strong> G<strong>in</strong>i coefficient<br />
1<br />
0<br />
-1<br />
-2<br />
-3<br />
-4<br />
Bolivia<br />
(Plur. State <strong>of</strong>)<br />
Argent<strong>in</strong>a b<br />
Brazil<br />
Peru<br />
El Salvador<br />
Mexico<br />
Ecuador<br />
Colombia<br />
Chile<br />
Uruguay<br />
Paraguay<br />
Venezuela<br />
(Bol. Rep. <strong>of</strong>)<br />
Dom<strong>in</strong>ican Rep.<br />
Panama<br />
Costa Rica<br />
2002-2008 2008-2013<br />
Source: Economic Commission <strong>for</strong> Lat<strong>in</strong> <strong>America</strong> <strong>and</strong> <strong>the</strong> <strong>Caribbean</strong> (ECLAC), on <strong>the</strong> basis <strong>of</strong> special tabulations <strong>of</strong> data from household surveys conducted <strong>in</strong> <strong>the</strong> countries.<br />
a<br />
Includes only countries with <strong>in</strong><strong>for</strong>mation available up to 2011, 2012 or 2013. <strong>The</strong> countries are ordered by <strong>the</strong> variation recorded <strong>in</strong> <strong>the</strong> second subperiod (2008-2013).<br />
b<br />
Urban areas.<br />
21


