Annual Report of ACS Group - Grupo ACS
Annual Report of ACS Group - Grupo ACS
Annual Report of ACS Group - Grupo ACS

Create successful ePaper yourself
Turn your PDF publications into a flip-book with our unique Google optimized e-Paper software.
Consolidated<br />
Financial Statements<br />
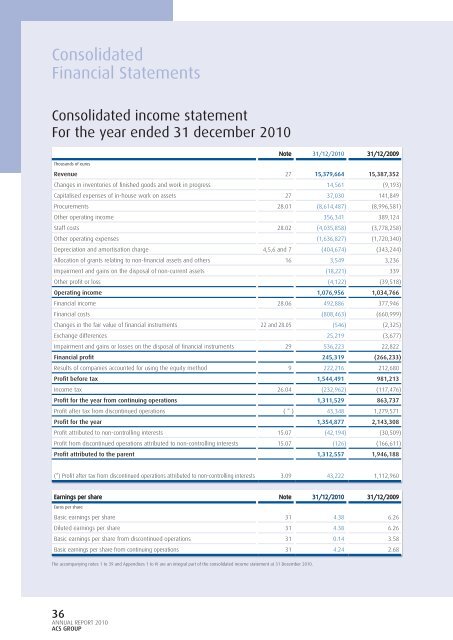
Consolidated income statement<br />
For the year ended 31 december 2010<br />
Thousands <strong>of</strong> euros<br />
36<br />
ANNUAL REPORT 2010<br />
<strong>ACS</strong> GROUP<br />
Note 31/12/2010 31/12/2009<br />
Revenue 27 15,379,664 15,387,352<br />
Changes in inventories <strong>of</strong> fi nished goods and work in progress 14,561 (9,193)<br />
Capitalised expenses <strong>of</strong> in-house work on assets 27 37,030 141,849<br />
Procurements 28.01 (8,614,487) (8,996,581)<br />
Other operating income 356,341 389,124<br />
Staff costs 28.02 (4,035,858) (3,778,258)<br />
Other operating expenses (1,636,827) (1,720,340)<br />
Depreciation and amortisation charge 4,5,6 and 7 (404,674) (343,244)<br />
Allocation <strong>of</strong> grants relating to non-fi nancial assets and others 16 3,549 3,236<br />
Impairment and gains on the disposal <strong>of</strong> non-current assets (18,221) 339<br />
Other pr<strong>of</strong>i t or loss (4,122) (39,518)<br />
Operating income 1,076,956 1,034,766<br />
Financial income 28.06 492,886 377,946<br />
Financial costs (808,463) (660,999)<br />
Changes in the fair value <strong>of</strong> fi nancial instruments 22 and 28.05 (546) (2,325)<br />
Exchange differences 25,219 (3,677)<br />
Impairment and gains or losses on the disposal <strong>of</strong> fi nancial instruments 29 536,223 22,822<br />
Financial pr<strong>of</strong>i t 245,319 (266,233)<br />
Results <strong>of</strong> companies accounted for using the equity method 9 222,216 212,680<br />
Pr<strong>of</strong>i t before tax 1,544,491 981,213<br />
Income tax 26.04 (232,962) (117,476)<br />
Pr<strong>of</strong>i t for the year from continuing operations 1,311,529 863,737<br />
Pr<strong>of</strong>i t after tax from discontinued operations ( * ) 43,348 1,279,571<br />
Pr<strong>of</strong>i t for the year 1,354,877 2,143,308<br />
Pr<strong>of</strong>i t attributed to non-controlling interests 15.07 (42,194) (30,509)<br />
Pr<strong>of</strong>i t from discontinued operations attributed to non-controlling interests 15.07 (126) (166,611)<br />
Pr<strong>of</strong>i t attributed to the parent 1,312,557 1,946,188<br />
(*) Pr<strong>of</strong>i t after tax from discontinued operations attributed to non-controlling interests 3.09 43,222 1,112,960<br />
Earnings per share Note 31/12/2010 31/12/2009<br />
Euros per share<br />
Basic earnings per share 31 4.38 6.26<br />
Diluted earnings per share 31 4.38 6.26<br />
Basic earnings per share from discontinued operations 31 0.14 3.58<br />
Basic earnings per share from continuing operations 31 4.24 2.68<br />
The accompanying notes 1 to 39 and Appendices 1 to IV are an integral part <strong>of</strong> the consolidated income statement at 31 December 2010.