Annual Report of ACS Group - Grupo ACS
Annual Report of ACS Group - Grupo ACS
Annual Report of ACS Group - Grupo ACS

You also want an ePaper? Increase the reach of your titles
YUMPU automatically turns print PDFs into web optimized ePapers that Google loves.
Consolidated<br />
Financial Statements<br />
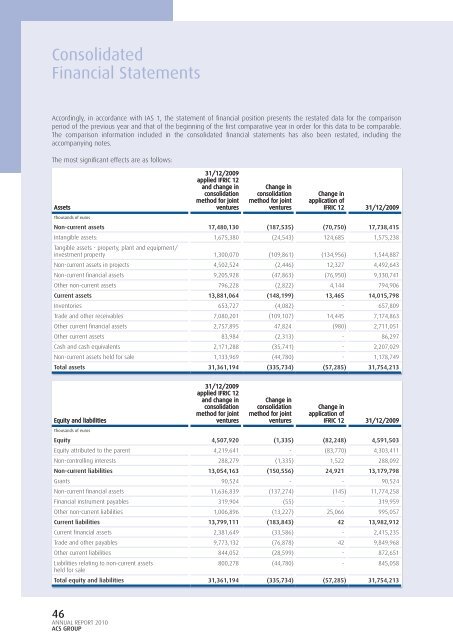
Accordingly, in accordance with IAS 1, the statement <strong>of</strong> fi nancial position presents the restated data for the comparison<br />
period <strong>of</strong> the previous year and that <strong>of</strong> the beginning <strong>of</strong> the fi rst comparative year in order for this data to be comparable.<br />
The comparison information included in the consolidated fi nancial statements has also been restated, including the<br />
accompanying notes.<br />
The most signifi cant effects are as follows:<br />
Assets<br />
Thousands <strong>of</strong> euros<br />
46<br />
ANNUAL REPORT 2010<br />
<strong>ACS</strong> GROUP<br />
31/12/2009<br />
applied IFRIC 12<br />
and change in<br />
consolidation<br />
method for joint<br />
ventures<br />
Change in<br />
consolidation<br />
method for joint<br />
ventures<br />
Change in<br />
application <strong>of</strong><br />
IFRIC 12 31/12/2009<br />
Non-current assets 17,480,130 (187,535) (70,750) 17,738,415<br />
Intangible assets:<br />
Tangible assets - property, plant and equipment/<br />
1,675,380 (24,543) 124,685 1,575,238<br />
investment property 1,300,070 (109,861) (134,956) 1,544,887<br />
Non-current assets in projects 4,502,524 (2,446) 12,327 4,492,643<br />
Non-current fi nancial assets 9,205,928 (47,863) (76,950) 9,330,741<br />
Other non-current assets 796,228 (2,822) 4,144 794,906<br />
Current assets 13,881,064 (148,199) 13,465 14,015,798<br />
Inventories 653,727 (4,082) - 657,809<br />
Trade and other receivables 7,080,201 (109,107) 14,445 7,174,863<br />
Other current fi nancial assets 2,757,895 47,824 (980) 2,711,051<br />
Other current assets 83,984 (2,313) - 86,297<br />
Cash and cash equivalents 2,171,288 (35,741) - 2,207,029<br />
Non-current assets held for sale 1,133,969 (44,780) - 1,178,749<br />
Total assets 31,361,194 (335,734) (57,285) 31,754,213<br />
Equity and liabilities<br />
Thousands <strong>of</strong> euros<br />
31/12/2009<br />
applied IFRIC 12<br />
and change in<br />
consolidation<br />
method for joint<br />
ventures<br />
Change in<br />
consolidation<br />
method for joint<br />
ventures<br />
Change in<br />
application <strong>of</strong><br />
IFRIC 12 31/12/2009<br />
Equity 4,507,920 (1,335) (82,248) 4,591,503<br />
Equity attributed to the parent 4,219,641 - (83,770) 4,303,411<br />
Non-controlling interests 288,279 (1,335) 1,522 288,092<br />
Non-current liabilities 13,054,163 (150,556) 24,921 13,179,798<br />
Grants 90,524 - - 90,524<br />
Non-current fi nancial assets 11,636,839 (137,274) (145) 11,774,258<br />
Financial instrument payables 319,904 (55) - 319,959<br />
Other non-current liabilities 1,006,896 (13,227) 25,066 995,057<br />
Current liabilities 13,799,111 (183,843) 42 13,982,912<br />
Current fi nancial assets 2,381,649 (33,586) - 2,415,235<br />
Trade and other payables 9,773,132 (76,878) 42 9,849,968<br />
Other current liabilities 844,052 (28,599) - 872,651<br />
Liabilities relating to non-current assets<br />
held for sale<br />
800,278 (44,780) - 845,058<br />
Total equity and liabilities 31,361,194 (335,734) (57,285) 31,754,213