Annual Report of ACS Group - Grupo ACS
Annual Report of ACS Group - Grupo ACS
Annual Report of ACS Group - Grupo ACS

You also want an ePaper? Increase the reach of your titles
YUMPU automatically turns print PDFs into web optimized ePapers that Google loves.
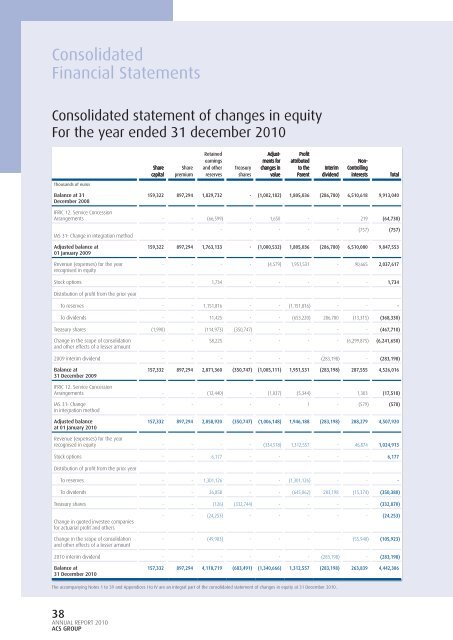
Consolidated<br />
Financial Statements<br />
Consolidated statement <strong>of</strong> changes in equity<br />
For the year ended 31 december 2010<br />
Thousands <strong>of</strong> euros<br />
Balance at 31<br />
December 2008<br />
38<br />
ANNUAL REPORT 2010<br />
<strong>ACS</strong> GROUP<br />
Share<br />
capital<br />
Share<br />
premium<br />
Retained<br />
earnings<br />
and other<br />
reserves<br />
Treasury<br />
shares<br />
Adjust- Adjust-<br />
ments for<br />
changes in<br />
value<br />
Pr<strong>of</strong>i t<br />
attributed<br />
to the<br />
Parent<br />
Interim<br />
dividend<br />
Non-<br />
Controlling<br />
interests Total<br />
159,322 897,294 1,829,732 - (1,002,182) 1,805,036 (286,780) 6,510,618 9,913,040<br />
IFRIC 12. Service Concession<br />
Arrangements - - (66,599) - 1,650 - - 219 (64,730)<br />
IAS 31- Change in integration method<br />
Adjusted balance at<br />
01 January 2009<br />
Revenue (expenses) for the year<br />
recognised in equity<br />
- - - - - - - (757) (757)<br />
159,322 897,294 1,763,133 - (1,000,532) 1,805,036 (286,780) 6,510,080 9,847,553<br />
- - - - (4,579) 1,951,531 - 90,665 2,037,617<br />
Stock options - - 1,734 - - - - - 1,734<br />
Distribution <strong>of</strong> pr<strong>of</strong>i t from the prior year<br />
To reserves - - 1,151,816 - - (1,151,816) - - -<br />
To dividends - - 11,425 - - (653,220) 286,780 (13,315) (368,330)<br />
Treasury shares (1,990) - (114,973) (350,747) - - - - (467,710)<br />
Change in the scope <strong>of</strong> consolidation<br />
and other effects <strong>of</strong> a lesser amount<br />
- - 58,225 - - - - (6,299,875) (6,241,650)<br />
2009 interim dividend - - - - - - (283,198) - (283,198)<br />
Balance at<br />
31 December 2009<br />
157,332 897,294 2,871,360 (350,747) (1,005,111) 1,951,531 (283,198) 287,555 4,526,016<br />
IFRIC 12. Service Concession<br />
Arrangements - - (12,440) - (1,037) (5,344) - 1,303 (17,518)<br />
IAS 31- Change<br />
in integration method<br />
Adjusted balance<br />
at 01 January 2010<br />
- - - - - 1 - (579) (578)<br />
157,332 897,294 2,858,920 (350,747) (1,006,148) 1,946,188 (283,198) 288,279 4,507,920<br />
Revenue (expenses) for the year<br />
recognised in equity - - - - (334,518) 1,312,557 - 46,874 1,024,913<br />
Stock options - - 6,177 - - - - - 6,177<br />
Distribution <strong>of</strong> pr<strong>of</strong>i t from the prior year<br />
To reserves - - 1,301,126 - - (1,301,126) - - -<br />
To dividends - - 26,858 - - (645,062) 283,198 (15,374) (350,380)<br />
Treasury shares - - (126) (332,744) - - - - (332,870)<br />
Change in quoted investee companies<br />
for actuarial pr<strong>of</strong>i t and others<br />
Change in the scope <strong>of</strong> consolidation<br />
and other effects <strong>of</strong> a lesser amount<br />
- - (24,253) - - - - - (24,253)<br />
- - (49,983) - - - - (55,940) (105,923)<br />
2010 interim dividend - - - - - - (283,198) - (283,198)<br />
Balance at<br />
31 December 2010<br />
157,332 897,294 4,118,719 (683,491) (1,340,666) 1,312,557 (283,198) 263,839 4,442,386<br />
The accompanying Notes 1 to 39 and Appendices I to IV are an integral part <strong>of</strong> the consolidated statement <strong>of</strong> changes in equity at 31 December 2010..