

Loddon Tracks and Trails Strategy - Loddon Shire Council
Loddon Tracks and Trails Strategy - Loddon Shire Council
Loddon Tracks and Trails Strategy - Loddon Shire Council

Create successful ePaper yourself
Turn your PDF publications into a flip-book with our unique Google optimized e-Paper software.
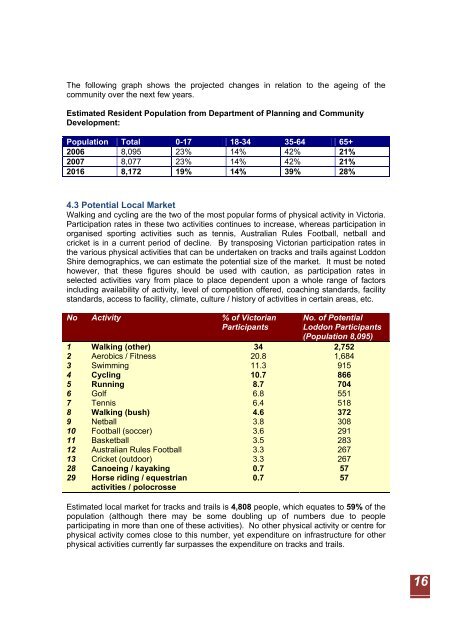
The following graph shows the projected changes in relation to the ageing of the<br />
community over the next few years.<br />
Estimated Resident Population from Department of Planning <strong>and</strong> Community<br />
Development:<br />
Population Total 0-17 18-34 35-64 65+<br />
2006 8,095 23% 14% 42% 21%<br />
2007 8,077 23% 14% 42% 21%<br />
2016 8,172 19% 14% 39% 28%<br />
4.3 Potential Local Market<br />
Walking <strong>and</strong> cycling are the two of the most popular forms of physical activity in Victoria.<br />
Participation rates in these two activities continues to increase, whereas participation in<br />
organised sporting activities such as tennis, Australian Rules Football, netball <strong>and</strong><br />
cricket is in a current period of decline. By transposing Victorian participation rates in<br />
the various physical activities that can be undertaken on tracks <strong>and</strong> trails against <strong>Loddon</strong><br />
<strong>Shire</strong> demographics, we can estimate the potential size of the market. It must be noted<br />
however, that these figures should be used with caution, as participation rates in<br />
selected activities vary from place to place dependent upon a whole range of factors<br />
including availability of activity, level of competition offered, coaching st<strong>and</strong>ards, facility<br />
st<strong>and</strong>ards, access to facility, climate, culture / history of activities in certain areas, etc.<br />
No Activity % of Victorian<br />
Participants<br />
No. of Potential<br />
<strong>Loddon</strong> Participants<br />
(Population 8,095)<br />
1 Walking (other) 34 2,752<br />
2 Aerobics / Fitness 20.8 1,684<br />
3 Swimming 11.3 915<br />
4 Cycling 10.7 866<br />
5 Running 8.7 704<br />
6 Golf 6.8 551<br />
7 Tennis 6.4 518<br />
8 Walking (bush) 4.6 372<br />
9 Netball 3.8 308<br />
10 Football (soccer) 3.6 291<br />
11 Basketball 3.5 283<br />
12 Australian Rules Football 3.3 267<br />
13 Cricket (outdoor) 3.3 267<br />
28 Canoeing / kayaking 0.7 57<br />
29 Horse riding / equestrian<br />
activities / polocrosse<br />
0.7 57<br />
Estimated local market for tracks <strong>and</strong> trails is 4,808 people, which equates to 59% of the<br />
population (although there may be some doubling up of numbers due to people<br />
participating in more than one of these activities). No other physical activity or centre for<br />
physical activity comes close to this number, yet expenditure on infrastructure for other<br />
physical activities currently far surpasses the expenditure on tracks <strong>and</strong> trails.<br />
16