

Committed to growth
EuroChem-2015-Annual-Report-v2
EuroChem-2015-Annual-Report-v2

You also want an ePaper? Increase the reach of your titles
YUMPU automatically turns print PDFs into web optimized ePapers that Google loves.
Financial Statements<br />
Notes <strong>to</strong> the Consolidated Financial Statements<br />
for the year ended 31 December 2015 continued<br />
(all amounts are presented in thousands of US dollars, unless otherwise stated)<br />
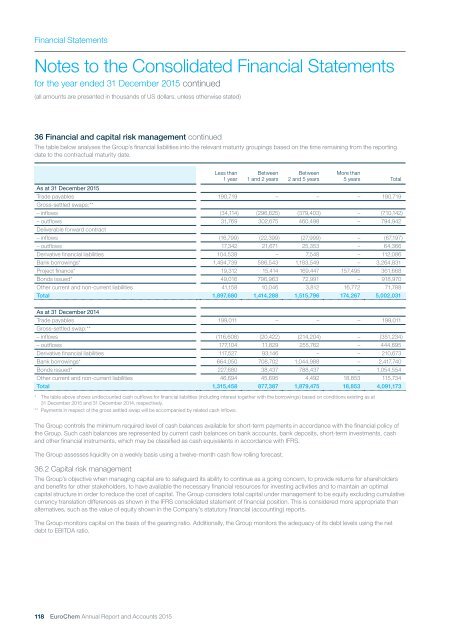
36 Financial and capital risk management continued<br />
The table below analyses the Group’s financial liabilities in<strong>to</strong> the relevant maturity groupings based on the time remaining from the reporting<br />
date <strong>to</strong> the contractual maturity date.<br />
Less than<br />
1 year<br />
Between<br />
1 and 2 years<br />
Between<br />
2 and 5 years<br />
More than<br />
5 years Total<br />
As at 31 December 2015<br />
Trade payables 190,719 – – – 190,719<br />
Gross-settled swaps:**<br />
– inflows (34,114) (296,625) (379,403) – (710,142)<br />
– outflows 31,769 302,675 460,498 – 794,942<br />
Deliverable forward contract<br />
– inflows (16,799) (22,399) (27,999) – (67,197)<br />
– outflows 17,342 21,671 25,353 – 64,366<br />
Derivative financial liabilities 104,538 – 7,548 – 112,086<br />
Bank borrowings* 1,494,739 586,543 1,183,549 – 3,264,831<br />
Project finance* 19,312 15,414 169,447 157,495 361,668<br />
Bonds issued* 49,016 796,963 72,991 – 918,970<br />
Other current and non-current liabilities 41,158 10,046 3,812 16,772 71,788<br />
Total 1,897,680 1,414,288 1,515,796 174,267 5,002,031<br />
As at 31 December 2014<br />
Trade payables 199,011 – – – 199,011<br />
Gross-settled swap:**<br />
– inflows (116,608) (20,422) (214,204) – (351,234)<br />
– outflows 177,104 11,829 255,762 – 444,695<br />
Derivative financial liabilities 117,527 93,146 – – 210,673<br />
Bank borrowings* 664,050 708,702 1,044,988 – 2,417,740<br />
Bonds issued* 227,680 38,437 788,437 – 1,054,554<br />
Other current and non-current liabilities 46,694 45,695 4,492 18,853 115,734<br />
Total 1,315,458 877,387 1,879,475 18,853 4,091,173<br />
* The table above shows undiscounted cash outflows for financial liabilities (including interest <strong>to</strong>gether with the borrowings) based on conditions existing as at<br />
31 December 2015 and 31 December 2014, respectively.<br />
** Payments in respect of the gross settled swap will be accompanied by related cash inflows.<br />
The Group controls the minimum required level of cash balances available for short-term payments in accordance with the financial policy of<br />
the Group. Such cash balances are represented by current cash balances on bank accounts, bank deposits, short-term investments, cash<br />
and other financial instruments, which may be classified as cash equivalents in accordance with IFRS.<br />
The Group assesses liquidity on a weekly basis using a twelve-month cash flow rolling forecast.<br />
36.2 Capital risk management<br />
The Group’s objective when managing capital are <strong>to</strong> safeguard its ability <strong>to</strong> continue as a going concern, <strong>to</strong> provide returns for shareholders<br />
and benefits for other stakeholders, <strong>to</strong> have available the necessary financial resources for investing activities and <strong>to</strong> maintain an optimal<br />
capital structure in order <strong>to</strong> reduce the cost of capital. The Group considers <strong>to</strong>tal capital under management <strong>to</strong> be equity excluding cumulative<br />
currency translation differences as shown in the IFRS consolidated statement of financial position. This is considered more appropriate than<br />
alternatives, such as the value of equity shown in the Company’s statu<strong>to</strong>ry financial (accounting) reports.<br />
The Group moni<strong>to</strong>rs capital on the basis of the gearing ratio. Additionally, the Group moni<strong>to</strong>rs the adequacy of its debt levels using the net<br />
debt <strong>to</strong> EBITDA ratio.<br />
118 EuroChem Annual Report and Accounts 2015