

Committed to growth
EuroChem-2015-Annual-Report-v2
EuroChem-2015-Annual-Report-v2

You also want an ePaper? Increase the reach of your titles
YUMPU automatically turns print PDFs into web optimized ePapers that Google loves.
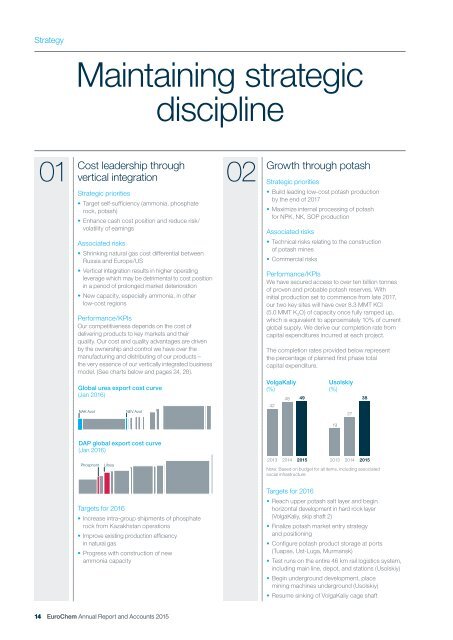
Strategy<br />
Maintaining strategic<br />
discipline<br />
01<br />
Cost leadership through<br />
vertical integration<br />
Strategic priorities<br />
• Target self-sufficiency (ammonia, phosphate<br />
rock, potash)<br />
• Enhance cash cost position and reduce risk/<br />
volatility of earnings<br />
Associated risks<br />
• Shrinking natural gas cost differential between<br />
Russia and Europe/US<br />
• Vertical integration results in higher operating<br />
leverage which may be detrimental <strong>to</strong> cost position<br />
in a period of prolonged market deterioration<br />
• New capacity, especially ammonia, in other<br />
low-cost regions<br />
Performance/KPIs<br />
Our competitiveness depends on the cost of<br />
delivering products <strong>to</strong> key markets and their<br />
quality. Our cost and quality advantages are driven<br />
by the ownership and control we have over the<br />
manufacturing and distributing of our products –<br />
the very essence of our vertically integrated business<br />
model. (See charts below and pages 24, 28).<br />
02<br />
Growth through potash<br />
Strategic priorities<br />
• Build leading low-cost potash production<br />
by the end of 2017<br />
• Maximize internal processing of potash<br />
for NPK, NK, SOP production<br />
Associated risks<br />
• Technical risks relating <strong>to</strong> the construction<br />
of potash mines<br />
• Commercial risks<br />
Performance/KPIs<br />
We have secured access <strong>to</strong> over ten billion <strong>to</strong>nnes<br />
of proven and probable potash reserves. With<br />
initial production set <strong>to</strong> commence from late 2017,<br />
our two key sites will have over 8.3 MMT KCI<br />
(5.0 MMT K 2 O) of capacity once fully ramped up,<br />
which is equivalent <strong>to</strong> approximately 10% of current<br />
global supply. We derive our completion rate from<br />
capital expenditures incurred at each project.<br />
The completion rates provided below represent<br />
the percentage of planned first phase <strong>to</strong>tal<br />
capital expenditure.<br />
Global urea export cost curve<br />
(Jan 2016)<br />
NAK Azot<br />
NEV Azot<br />
VolgaKaliy<br />
(%)<br />
42<br />
48<br />
49<br />
Usolskiy<br />
(%)<br />
27<br />
38<br />
19<br />
DAP global export cost curve<br />
(Jan 2016)<br />
Phosphorit<br />
Lifosa<br />
2013<br />
2014<br />
2015<br />
2013<br />
2014<br />
2015<br />
Note: Based on budget for all items, including associated<br />
social infrastructure<br />
Targets for 2016<br />
• Increase intra-group shipments of phosphate<br />
rock from Kazakhstan operations<br />
• Improve existing production efficiency<br />
in natural gas<br />
• Progress with construction of new<br />
ammonia capacity<br />
Targets for 2016<br />
• Reach upper potash salt layer and begin<br />
horizontal development in hard rock layer<br />
(VolgaKaliy, skip shaft 2)<br />
• Finalize potash market entry strategy<br />
and positioning<br />
• Configure potash product s<strong>to</strong>rage at ports<br />
(Tuapse, Ust-Luga, Murmansk)<br />
• Test runs on the entire 46 km rail logistics system,<br />
including main line, depot, and stations (Usolskiy)<br />
• Begin underground development, place<br />
mining machines underground (Usolskiy)<br />
• Resume sinking of VolgaKaliy cage shaft<br />
14 EuroChem Annual Report and Accounts 2015