

Committed to growth
EuroChem-2015-Annual-Report-v2
EuroChem-2015-Annual-Report-v2

You also want an ePaper? Increase the reach of your titles
YUMPU automatically turns print PDFs into web optimized ePapers that Google loves.
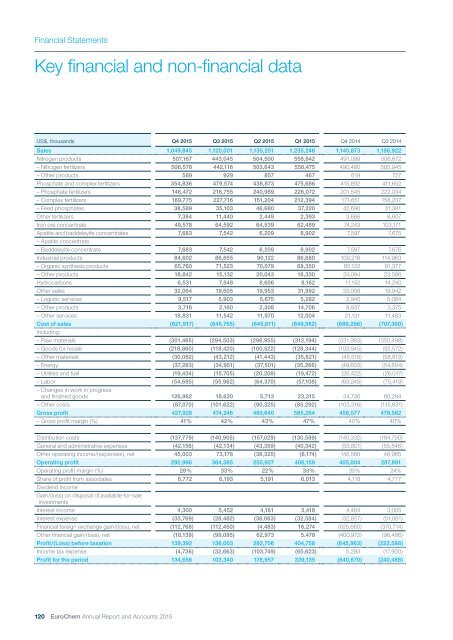
Financial Statements<br />
Key financial and non-financial data<br />
US$, thousands Q4 2015 Q3 2015 Q2 2015 Q1 2015 Q4 2014 Q3 2014<br />
Sales 1,049,845 1,120,001 1,135,251 1,235,246 1,145,873 1,186,922<br />
Nitrogen products 507,167 443,045 504,500 558,942 491,099 506,672<br />
– Nitrogen fertilizers 506,578 442,116 503,643 558,475 490,480 505,945<br />
– Other products 589 929 857 467 619 727<br />
Phosphate and complex fertilizers 354,836 479,574 438,873 475,686 415,892 411,652<br />
– Phosphate fertilizers 146,472 216,755 240,989 226,072 201,545 222,034<br />
– Complex fertilizers 169,775 227,716 151,204 212,394 171,651 158,237<br />
– Feed phosphates 38,589 35,103 46,680 37,220 42,696 31,381<br />
Other fertilizers 7,384 11,440 2,449 2,393 3,666 8,607<br />
Iron ore concentrate 49,578 64,592 64,539 62,489 74,243 103,171<br />
Apatite and baddeleyite concentrates 7,683 7,542 6,209 8,902 7,597 7,675<br />
– Apatite concentrate<br />
– Baddeleyite concentrate 7,683 7,542 6,209 8,902 7,597 7,675<br />
Industrial products 84,602 86,655 90,122 86,680 109,216 114,963<br />
– Organic synthesis products 65,760 71,523 70,079 68,350 85,122 91,377<br />
– Other products 18,842 15,132 20,043 18,330 24,094 23,586<br />
Hydrocarbons 6,531 7,548 8,606 8,162 11,152 14,240<br />
Other sales 32,064 19,605 19,953 31,992 33,008 19,942<br />
– Logistic services 9,517 5,903 5,675 5,282 2,940 5,084<br />
– Other products 3,716 2,160 2,308 14,706 8,937 3,375<br />
– Other services 18,831 11,542 11,970 12,004 21,131 11,483<br />
Cost of sales (621,917) (645,755) (645,611) (649,982) (689,296) (707,360)<br />
Including:<br />
– Raw materials (301,465) (294,503) (296,955) (312,194) (331,983) (350,498)<br />
– Goods for resale (218,860) (118,420) (100,522) (128,344) (103,945) (92,572)<br />
– Other materials (30,082) (43,212) (41,443) (35,621) (45,518) (58,913)<br />
– Energy (37,283) (34,951) (37,501) (35,266) (49,603) (54,604)<br />
– Utilities and fuel (19,434) (15,705) (20,208) (19,472) (26,422) (26,017)<br />
– Labor (54,685) (55,962) (64,370) (57,108) (63,245) (75,419)<br />
– Changes in work in progress<br />
and finished goods 126,962 18,620 5,713 23,315 34,736 66,294<br />
– Other costs (87,070) (101,622) (90,325) (85,292) (103,316) (115,631)<br />
Gross profit 427,928 474,246 489,640 585,264 456,577 479,562<br />
– Gross profit margin (%) 41% 42% 43% 47% 40% 40%<br />
Distribution costs (137,779) (140,905) (157,029) (130,589) (140,332) (184,790)<br />
General and administrative expenses (42,156) (42,134) (43,359) (40,342) (53,801) (55,846)<br />
Other operating income/(expenses), net 45,003 73,178 (38,325) (8,174) 142,560 48,965<br />
Operating profit 292,996 364,385 250,927 406,159 405,004 287,891<br />
Operating profit margin (%) 28% 33% 22% 33% 35% 24%<br />
Share of profit from associates 6,772 6,193 5,191 6,013 4,118 4,777<br />
Dividend income<br />
Gain/(loss) on disposal of available-for-sale<br />
investments<br />
Interest income 4,300 5,452 4,161 3,418 4,404 3,005<br />
Interest expense (33,769) (28,482) (36,063) (32,584) (32,857) (51,061)<br />
Financial foreign exchange gain/(loss), net (112,768) (112,450) (4,483) 16,274 (625,660) (370,714)<br />
Other financial gain/(loss), net (18,139) (99,095) 62,973 5,478 (400,972) (96,486)<br />
Profit/(Loss) before taxation 139,392 136,003 282,706 404,758 (645,963) (222,588)<br />
Income tax expense (4,736) (32,663) (103,749) (65,623) 5,293 (17,900)<br />
Profit for the period 134,656 103,340 178,957 339,135 (640,670) (240,488)<br />
120 EuroChem Annual Report and Accounts 2015