You also want an ePaper? Increase the reach of your titles
YUMPU automatically turns print PDFs into web optimized ePapers that Google loves.
Additionally, we have obtained a high-low daily volatility measure. We have chosen the<br />
volatility measure proposed by Garman and Klass (1980) due to its higher relative<br />
efficiency than the standard estimators. The Garman and Klass volatility measure<br />
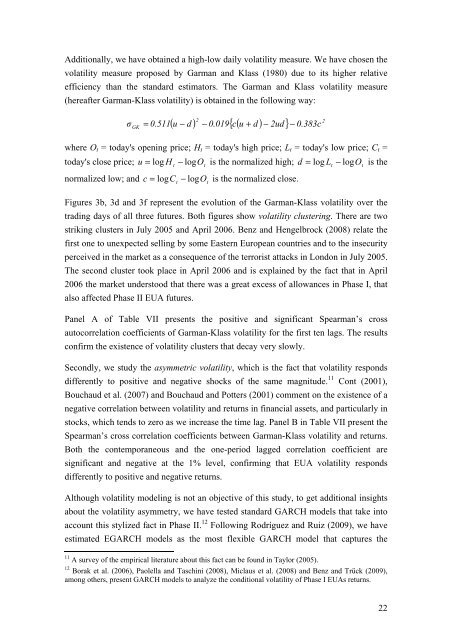
(hereafter Garman-Klass volatility) is obtained in the following way:<br />
σ<br />
GK<br />
= 0.511 u<br />
2<br />
2<br />
( − d ) − 0.019{ c( u + d ) − 2ud} − 0.383c<br />
where O t = today's opening price; H t = today's high price; L t = today's low price; C t =<br />
today's close price; u = log H t<br />
− logOt<br />
is the normalized high; d = log L t<br />
− logOt<br />
is the<br />
normalized low; and c = logC t<br />
− logO<br />
is the normalized close.<br />
t<br />
Figures 3b, 3d and 3f represent the evolution of the Garman-Klass volatility over the<br />
trading days of all three futures. Both figures show volatility clustering. There are two<br />
striking clusters in July 2005 and April 2006. Benz and Hengelbrock (2008) relate the<br />
first one to unexpected selling by some Eastern European countries and to the insecurity<br />
perceived in the market as a consequence of the terrorist attacks in London in July 2005.<br />
The second cluster took place in April 2006 and is explained by the fact that in April<br />
2006 the market understood that there was a great excess of allowances in Phase I, that<br />
also affected Phase II EUA futures.<br />
Panel A of Table VII presents the positive and significant Spearman’s cross<br />
autocorrelation coefficients of Garman-Klass volatility for the first ten lags. The results<br />
confirm the existence of volatility clusters that decay very slowly.<br />
Secondly, we study the asymmetric volatility, which is the fact that volatility responds<br />
differently to positive and negative shocks of the same magnitude. 11 Cont (2001),<br />
Bouchaud et al. (2007) and Bouchaud and Potters (2001) comment on the existence of a<br />
negative correlation between volatility and returns in financial assets, and particularly in<br />
stocks, which tends to zero as we increase the time lag. Panel B in Table VII present the<br />
Spearman’s cross correlation coefficients between Garman-Klass volatility and returns.<br />
Both the contemporaneous and the one-period lagged correlation coefficient are<br />
significant and negative at the 1% level, confirming that EUA volatility responds<br />
differently to positive and negative returns.<br />
Although volatility modeling is not an objective of this study, to get additional insights<br />
about the volatility asymmetry, we have tested standard GARCH models that take into<br />
account this stylized fact in Phase II. 12 Following Rodríguez and Ruiz (2009), we have<br />
estimated EGARCH models as the most flexible GARCH model that captures the<br />
11 A survey of the empirical literature about this fact can be found in Taylor (2005).<br />
12 Borak et al. (2006), Paolella and Taschini (2008), Miclaus et al. (2008) and Benz and Trück (2009),<br />
among others, present GARCH models to analyze the conditional volatility of Phase I EUAs returns.<br />
22


