


You also want an ePaper? Increase the reach of your titles
YUMPU automatically turns print PDFs into web optimized ePapers that Google loves.
Euribor rate as a proxy, leaving the non-expected inflation as the difference between the<br />
observed and the expected inflation.<br />
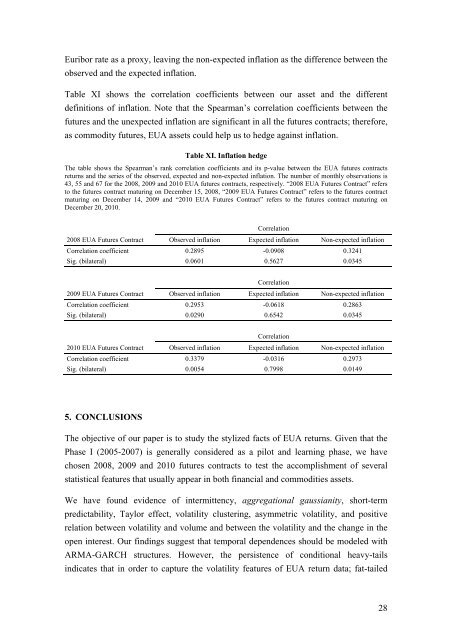
Table XI shows the correlation coefficients between our asset and the different<br />
definitions of inflation. Note that the Spearman’s correlation coefficients between the<br />
futures and the unexpected inflation are significant in all the futures contracts; therefore,<br />
as commodity futures, EUA assets could help us to hedge against inflation.<br />
Table XI. Inflation hedge<br />
The table shows the Spearman’s rank correlation coefficients and its p-value between the EUA futures contracts<br />
returns and the series of the observed, expected and non-expected inflation. The number of monthly observations is<br />
43, 55 and 67 for the 2008, 2009 and 2010 EUA futures contracts, respectively. “2008 EUA Futures Contract” refers<br />
to the futures contract maturing on December 15, 2008, “2009 EUA Futures Contract” refers to the futures contract<br />
maturing on December 14, 2009 and “2010 EUA Futures Contract” refers to the futures contract maturing on<br />
December 20, 2010.<br />
Correlation<br />
2008 EUA Futures Contract Observed inflation Expected inflation Non-expected inflation<br />
Correlation coefficient 0.2895 -0.0908 0.3241<br />
Sig. (bilateral) 0.0601 0.5627 0.0345<br />
Correlation<br />
2009 EUA Futures Contract Observed inflation Expected inflation Non-expected inflation<br />
Correlation coefficient 0.2953 -0.0618 0.2863<br />
Sig. (bilateral) 0.0290 0.6542 0.0345<br />
Correlation<br />
2010 EUA Futures Contract Observed inflation Expected inflation Non-expected inflation<br />
Correlation coefficient 0.3379 -0.0316 0.2973<br />
Sig. (bilateral) 0.0054 0.7998 0.0149<br />
5. CONCLUSIONS<br />
The objective of our paper is to study the stylized facts of EUA returns. Given that the<br />
Phase I (2005-2007) is generally considered as a pilot and learning phase, we have<br />
chosen 2008, 2009 and 2010 futures contracts to test the accomplishment of several<br />
statistical features that usually appear in both financial and commodities assets.<br />
We have found evidence of intermittency, aggregational gaussianity, short-term<br />
predictability, Taylor effect, volatility clustering, asymmetric volatility, and positive<br />
relation between volatility and volume and between the volatility and the change in the<br />
open interest. Our findings suggest that temporal dependences should be modeled with<br />
ARMA-GARCH structures. However, the persistence of conditional heavy-tails<br />
indicates that in order to capture the volatility features of EUA return data; fat-tailed<br />
28


