


You also want an ePaper? Increase the reach of your titles
YUMPU automatically turns print PDFs into web optimized ePapers that Google loves.
non-trading hours, our results clearly indicate that information flow is concentrated<br />
during the business day, similar to the equity markets, and does not evolve randomly<br />
around the clock.<br />
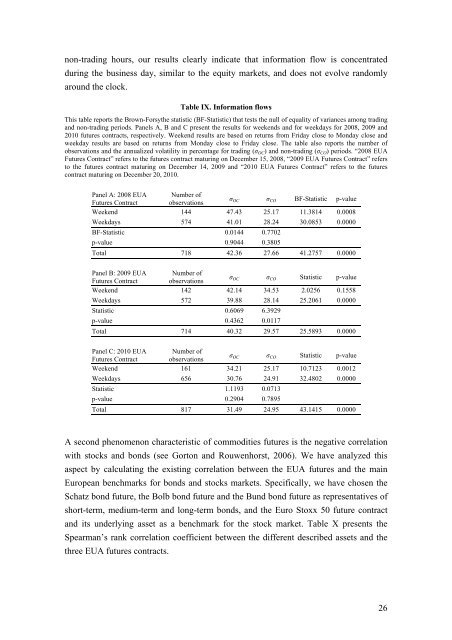
Table IX. Information flows<br />
This table reports the Brown-Forsythe statistic (BF-Statistic) that tests the null of equality of variances among trading<br />
and non-trading periods. Panels A, B and C present the results for weekends and for weekdays for 2008, 2009 and<br />
2010 futures contracts, respectively. Weekend results are based on returns from Friday close to Monday close and<br />
weekday results are based on returns from Monday close to Friday close. The table also reports the number of<br />
observations and the annualized volatility in percentage for trading (σ OC ) and non-trading (σ CO ) periods. “2008 EUA<br />
Futures Contract” refers to the futures contract maturing on December 15, 2008, “2009 EUA Futures Contract” refers<br />
to the futures contract maturing on December 14, 2009 and “2010 EUA Futures Contract” refers to the futures<br />
contract maturing on December 20, 2010.<br />
Panel A: 2008 EUA Number of<br />
Futures Contract observations<br />
σ OC σ CO BF-Statistic p-value<br />
Weekend 144 47.43 25.17 11.3814 0.0008<br />
Weekdays 574 41.01 28.24 30.0853 0.0000<br />
BF-Statistic 0.0144 0.7702<br />
p-value 0.9044 0.3805<br />
Total 718 42.36 27.66 41.2757 0.0000<br />
Panel B: 2009 EUA Number of<br />
Futures Contract observations<br />
σ OC σ CO Statistic p-value<br />
Weekend 142 42.14 34.53 2.0256 0.1558<br />
Weekdays 572 39.88 28.14 25.2061 0.0000<br />
Statistic 0.6069 6.3929<br />
p-value 0.4362 0.0117<br />
Total 714 40.32 29.57 25.5893 0.0000<br />
Panel C: 2010 EUA Number of<br />
Futures Contract observations<br />
σ OC σ CO Statistic p-value<br />
Weekend 161 34.21 25.17 10.7123 0.0012<br />
Weekdays 656 30.76 24.91 32.4802 0.0000<br />
Statistic 1.1193 0.0713<br />
p-value 0.2904 0.7895<br />
Total 817 31.49 24.95 43.1415 0.0000<br />
A second phenomenon characteristic of commodities futures is the negative correlation<br />
with stocks and bonds (see Gorton and Rouwenhorst, 2006). We have analyzed this<br />
aspect by calculating the existing correlation between the EUA futures and the main<br />
European benchmarks for bonds and stocks markets. Specifically, we have chosen the<br />
Schatz bond future, the Bolb bond future and the Bund bond future as representatives of<br />
short-term, medium-term and long-term bonds, and the Euro Stoxx 50 future contract<br />
and its underlying asset as a benchmark for the stock market. Table X presents the<br />
Spearman’s rank correlation coefficient between the different described assets and the<br />
three EUA futures contracts.<br />
26


