


Create successful ePaper yourself
Turn your PDF publications into a flip-book with our unique Google optimized e-Paper software.
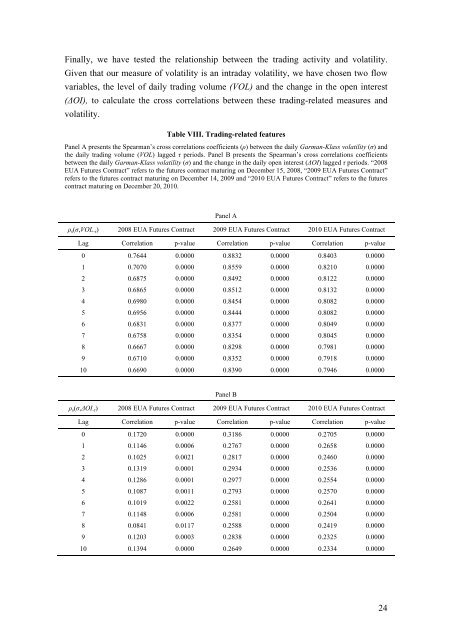
Finally, we have tested the relationship between the trading activity and volatility.<br />
Given that our measure of volatility is an intraday volatility, we have chosen two flow<br />
variables, the level of daily trading volume (VOL) and the change in the open interest<br />
(ΔOI), to calculate the cross correlations between these trading-related measures and<br />
volatility.<br />
Table VIII. Trading-related features<br />
Panel A presents the Spearman’s cross correlations coefficients (ρ) between the daily Garman-Klass volatility (σ) and<br />
the daily trading volume (VOL) lagged τ periods. Panel B presents the Spearman’s cross correlations coefficients<br />
between the daily Garman-Klass volatility (σ) and the change in the daily open interest (ΔOI) lagged τ periods. “2008<br />
EUA Futures Contract” refers to the futures contract maturing on December 15, 2008, “2009 EUA Futures Contract”<br />
refers to the futures contract maturing on December 14, 2009 and “2010 EUA Futures Contract” refers to the futures<br />
contract maturing on December 20, 2010.<br />
Panel A<br />
ρ s (σ,VOL -τ ) 2008 EUA Futures Contract 2009 EUA Futures Contract 2010 EUA Futures Contract<br />
Lag Correlation p-value Correlation p-value Correlation p-value<br />
0 0.7644 0.0000 0.8832 0.0000 0.8403 0.0000<br />
1 0.7070 0.0000 0.8559 0.0000 0.8210 0.0000<br />
2 0.6875 0.0000 0.8492 0.0000 0.8122 0.0000<br />
3 0.6865 0.0000 0.8512 0.0000 0.8132 0.0000<br />
4 0.6980 0.0000 0.8454 0.0000 0.8082 0.0000<br />
5 0.6956 0.0000 0.8444 0.0000 0.8082 0.0000<br />
6 0.6831 0.0000 0.8377 0.0000 0.8049 0.0000<br />
7 0.6758 0.0000 0.8354 0.0000 0.8045 0.0000<br />
8 0.6667 0.0000 0.8298 0.0000 0.7981 0.0000<br />
9 0.6710 0.0000 0.8352 0.0000 0.7918 0.0000<br />
10 0.6690 0.0000 0.8390 0.0000 0.7946 0.0000<br />
Panel B<br />
ρ s (σ,ΔOI -τ ) 2008 EUA Futures Contract 2009 EUA Futures Contract 2010 EUA Futures Contract<br />
Lag Correlation p-value Correlation p-value Correlation p-value<br />
0 0.1720 0.0000 0.3186 0.0000 0.2705 0.0000<br />
1 0.1146 0.0006 0.2767 0.0000 0.2658 0.0000<br />
2 0.1025 0.0021 0.2817 0.0000 0.2460 0.0000<br />
3 0.1319 0.0001 0.2934 0.0000 0.2536 0.0000<br />
4 0.1286 0.0001 0.2977 0.0000 0.2554 0.0000<br />
5 0.1087 0.0011 0.2793 0.0000 0.2570 0.0000<br />
6 0.1019 0.0022 0.2581 0.0000 0.2641 0.0000<br />
7 0.1148 0.0006 0.2581 0.0000 0.2504 0.0000<br />
8 0.0841 0.0117 0.2588 0.0000 0.2419 0.0000<br />
9 0.1203 0.0003 0.2838 0.0000 0.2325 0.0000<br />
10 0.1394 0.0000 0.2649 0.0000 0.2334 0.0000<br />
24


