

Zwart_Bastiaanssen_2004_Review of measured crop water productivity values for irrigated wheat, rice,
Zwart_Bastiaanssen_2004_Review of measured crop water productivity values for irrigated wheat, rice,
Zwart_Bastiaanssen_2004_Review of measured crop water productivity values for irrigated wheat, rice,

You also want an ePaper? Increase the reach of your titles
YUMPU automatically turns print PDFs into web optimized ePapers that Google loves.
S.J. <strong>Zwart</strong>, W.G.M. <strong>Bastiaanssen</strong> / Agricultural Water Management 69 (<strong>2004</strong>) 115–133 123<br />
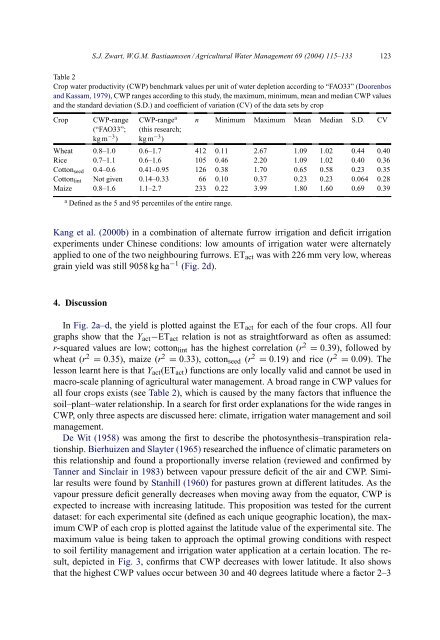
Table 2<br />
Crop <strong>water</strong> <strong>productivity</strong> (CWP) benchmark <strong>values</strong> per unit <strong>of</strong> <strong>water</strong> depletion according to “FAO33” (Doorenbos<br />
and Kassam, 1979), CWP ranges according to this study, the maximum, minimum, mean and median CWP <strong>values</strong><br />
and the standard deviation (S.D.) and coefficient <strong>of</strong> variation (CV) <strong>of</strong> the data sets by <strong>crop</strong><br />
Crop<br />
CWP-range<br />
(“FAO33”;<br />
kg m −3 )<br />
CWP-range a<br />
(this research;<br />
kg m −3 )<br />
n Minimum Maximum Mean Median S.D. CV<br />
Wheat 0.8–1.0 0.6–1.7 412 0.11 2.67 1.09 1.02 0.44 0.40<br />
Rice 0.7–1.1 0.6–1.6 105 0.46 2.20 1.09 1.02 0.40 0.36<br />
Cotton seed 0.4–0.6 0.41–0.95 126 0.38 1.70 0.65 0.58 0.23 0.35<br />
Cotton lint Not given 0.14–0.33 66 0.10 0.37 0.23 0.23 0.064 0.28<br />
Maize 0.8–1.6 1.1–2.7 233 0.22 3.99 1.80 1.60 0.69 0.39<br />
a Defined as the 5 and 95 percentiles <strong>of</strong> the entire range.<br />
Kang et al. (2000b) in a combination <strong>of</strong> alternate furrow irrigation and deficit irrigation<br />
experiments under Chinese conditions: low amounts <strong>of</strong> irrigation <strong>water</strong> were alternately<br />
applied to one <strong>of</strong> the two neighbouring furrows. ET act was with 226 mm very low, whereas<br />
grain yield was still 9058 kg ha −1 (Fig. 2d).<br />
4. Discussion<br />
In Fig. 2a–d, the yield is plotted against the ET act <strong>for</strong> each <strong>of</strong> the four <strong>crop</strong>s. All four<br />
graphs show that the Y act −ET act relation is not as straight<strong>for</strong>ward as <strong>of</strong>ten as assumed:<br />
r-squared <strong>values</strong> are low; cotton lint has the highest correlation (r 2 = 0.39), followed by<br />
<strong>wheat</strong> (r 2 = 0.35), maize (r 2 = 0.33), cotton seed (r 2 = 0.19) and <strong>rice</strong> (r 2 = 0.09). The<br />
lesson learnt here is that Y act (ET act ) functions are only locally valid and cannot be used in<br />
macro-scale planning <strong>of</strong> agricultural <strong>water</strong> management. A broad range in CWP <strong>values</strong> <strong>for</strong><br />
all four <strong>crop</strong>s exists (see Table 2), which is caused by the many factors that influence the<br />
soil–plant–<strong>water</strong> relationship. In a search <strong>for</strong> first order explanations <strong>for</strong> the wide ranges in<br />
CWP, only three aspects are discussed here: climate, irrigation <strong>water</strong> management and soil<br />
management.<br />
De Wit (1958) was among the first to describe the photosynthesis–transpiration relationship.<br />
Bierhuizen and Slayter (1965) researched the influence <strong>of</strong> climatic parameters on<br />
this relationship and found a proportionally inverse relation (reviewed and confirmed by<br />
Tanner and Sinclair in 1983) between vapour pressure deficit <strong>of</strong> the air and CWP. Similar<br />
results were found by Stanhill (1960) <strong>for</strong> pastures grown at different latitudes. As the<br />
vapour pressure deficit generally decreases when moving away from the equator, CWP is<br />
expected to increase with increasing latitude. This proposition was tested <strong>for</strong> the current<br />
dataset: <strong>for</strong> each experimental site (defined as each unique geographic location), the maximum<br />
CWP <strong>of</strong> each <strong>crop</strong> is plotted against the latitude value <strong>of</strong> the experimental site. The<br />
maximum value is being taken to approach the optimal growing conditions with respect<br />
to soil fertility management and irrigation <strong>water</strong> application at a certain location. The result,<br />
depicted in Fig. 3, confirms that CWP decreases with lower latitude. It also shows<br />
that the highest CWP <strong>values</strong> occur between 30 and 40 degrees latitude where a factor 2–3


