

Electricity & Gas Prices in Ireland
8fCy301FqPp
8fCy301FqPp

You also want an ePaper? Increase the reach of your titles
YUMPU automatically turns print PDFs into web optimized ePapers that Google loves.
10 ENERGY POLICY STATISTICAL SUPPORT UNIT<br />
2 Factors Affect<strong>in</strong>g <strong>Electricity</strong> and <strong>Gas</strong> <strong>Prices</strong> <strong>in</strong> <strong>Ireland</strong><br />
There are a number of factors that <strong>in</strong>fluence energy prices <strong>in</strong> <strong>Ireland</strong> and how prices here compare with prices<br />
elsewhere. These factors <strong>in</strong>clude, but are not limited to, imported fuel prices, energy <strong>in</strong>frastructure <strong>in</strong>vestment<br />
costs, <strong>Ireland</strong>’s electricity generat<strong>in</strong>g fuel mix and non-energy costs that affect energy prices (for example, taxes<br />
levied, employment costs, raw material and shipp<strong>in</strong>g costs).<br />
2 <strong>Electricity</strong> and <strong>Gas</strong> <strong>Prices</strong> <strong>in</strong> <strong>Ireland</strong><br />
2.1 Global Energy <strong>Prices</strong><br />
The most significant factor affect<strong>in</strong>g energy prices <strong>in</strong> <strong>Ireland</strong> is the <strong>in</strong>stability of global oil prices which have shown<br />
dramatic fluctuations <strong>in</strong> recent years. This has particular effect <strong>in</strong> <strong>Ireland</strong> due to our high dependence on oil. In<br />
addition there is the knock-on impact that oil prices have on other energy prices, <strong>in</strong> particular natural gas, and as a<br />
consequence electricity prices.<br />
Accord<strong>in</strong>g to <strong>Ireland</strong>’s 2014 3 energy balance, oil accounts for 57% of Total F<strong>in</strong>al Consumption (TFC) 4 <strong>in</strong> <strong>Ireland</strong>, 97% of<br />
transport TFC, 34% of residential TFC, 21% of <strong>in</strong>dustry TFC, 20% of services TFC and 47% of <strong>Ireland</strong>’s primary energy<br />
supply 5 . Accord<strong>in</strong>g to EU statistics 6 , <strong>Ireland</strong>’s oil dependence (as a proportion of primary energy supply) is the fifth<br />
highest <strong>in</strong> the EU.<br />
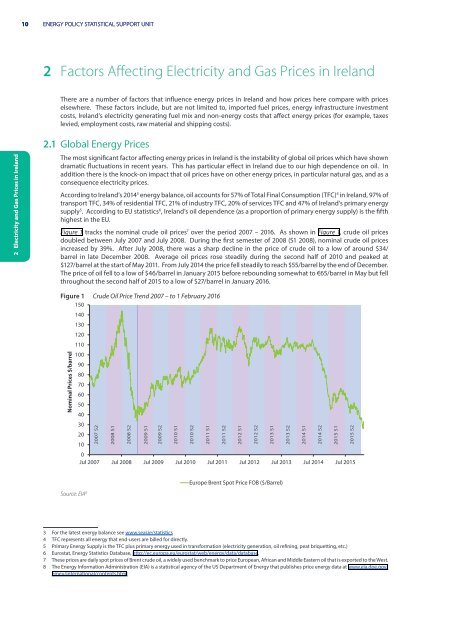
Figure 1 tracks the nom<strong>in</strong>al crude oil prices 7 over the period 2007 – 2016. As shown <strong>in</strong> Figure 1, crude oil prices<br />
doubled between July 2007 and July 2008. Dur<strong>in</strong>g the first semester of 2008 (S1 2008), nom<strong>in</strong>al crude oil prices<br />
<strong>in</strong>creased by 39%. After July 2008, there was a sharp decl<strong>in</strong>e <strong>in</strong> the price of crude oil to a low of around $34/<br />
barrel <strong>in</strong> late December 2008. Average oil prices rose steadily dur<strong>in</strong>g the second half of 2010 and peaked at<br />
$127/barrel at the start of May 2011. From July 2014 the price fell steadily to reach $55/barrel by the end of December.<br />
The price of oil fell to a low of $46/barrel <strong>in</strong> January 2015 before rebound<strong>in</strong>g somewhat to €65/barrel <strong>in</strong> May but fell<br />
throughout the second half of 2015 to a low of $27/barrel <strong>in</strong> January 2016.<br />
Figure 1 Crude Oil Price Trend 2007 – to 1 February 2016<br />
150<br />
140<br />
130<br />
120<br />
110<br />
Nom<strong>in</strong>al <strong>Prices</strong> $/barrel<br />
100<br />
90<br />
80<br />
70<br />
60<br />
50<br />
40<br />
30<br />
20<br />
10<br />
0<br />
Jul 2007 Jul 2008 Jul 2009 Jul 2010 Jul 2011 Jul 2012 Jul 2013 Jul 2014 Jul 2015<br />
2007 S2<br />
2008 S1<br />
2008 S2<br />
2009 S1<br />
2009 S2<br />
2010 S1<br />
2010 S2<br />
2011 S1<br />
2011 S2<br />
2012 S1<br />
2012 S2<br />
2013 S1<br />
2013 S2<br />
2014 S1<br />
2014 S2<br />
2015 S1<br />
2015 S2<br />
Source: EIA 8<br />
Europe Brent Spot Price FOB ($/Barrel)<br />
3 For the latest energy balance see www.seai.ie/statistics<br />
4 TFC represents all energy that end-users are billed for directly.<br />
5 Primary Energy Supply is the TFC plus primary energy used <strong>in</strong> transformation (electricity generation, oil ref<strong>in</strong><strong>in</strong>g, peat briquett<strong>in</strong>g, etc.)<br />
6 Eurostat, Energy Statistics Database, http://ec.europa.eu/eurostat/web/energy/data/database,<br />
7 These prices are daily spot prices of Brent crude oil, a widely used benchmark to price European, African and Middle Eastern oil that is exported to the West.<br />
8 The Energy Information Adm<strong>in</strong>istration (EIA) is a statistical agency of the US Department of Energy that publishes price energy data at www.eia.doe.gov/<br />
emeu/<strong>in</strong>ternational/contents.html