

Electricity & Gas Prices in Ireland
8fCy301FqPp
8fCy301FqPp

You also want an ePaper? Increase the reach of your titles
YUMPU automatically turns print PDFs into web optimized ePapers that Google loves.
42 ENERGY POLICY STATISTICAL SUPPORT UNIT<br />
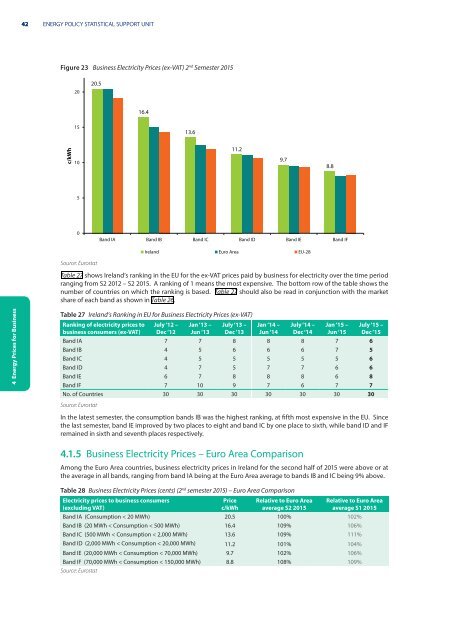
Figure 23 Bus<strong>in</strong>ess <strong>Electricity</strong> <strong>Prices</strong> (ex-VAT) 2 nd Semester 2015<br />
20<br />
20.5<br />
16.4<br />
15<br />
13.6<br />
c/kWh<br />
10<br />
11.2<br />
9.7<br />
8.8<br />
5<br />
0<br />
Band IA Band IB Band IC Band ID Band IE Band IF<br />
<strong>Ireland</strong> Euro Area EU-28<br />
Source: Eurostat<br />
Table 27 shows <strong>Ireland</strong>’s rank<strong>in</strong>g <strong>in</strong> the EU for the ex-VAT prices paid by bus<strong>in</strong>ess for electricity over the time period<br />
rang<strong>in</strong>g from S2 2012 – S2 2015. A rank<strong>in</strong>g of 1 means the most expensive. The bottom row of the table shows the<br />
number of countries on which the rank<strong>in</strong>g is based. Table 27 should also be read <strong>in</strong> conjunction with the market<br />
share of each band as shown <strong>in</strong> Table 26.<br />
4 Energy <strong>Prices</strong> for Bus<strong>in</strong>ess<br />
Table 27 <strong>Ireland</strong>’s Rank<strong>in</strong>g <strong>in</strong> EU for Bus<strong>in</strong>ess <strong>Electricity</strong> <strong>Prices</strong> (ex-VAT)<br />
Rank<strong>in</strong>g of electricity prices to<br />
bus<strong>in</strong>ess consumers (ex-VAT)<br />
July ‘12 –<br />
Dec ‘12<br />
Jan ‘13 –<br />
Jun ‘13<br />
July ‘13 –<br />
Dec ‘13<br />
Jan ‘14 –<br />
Jun ‘14<br />
July ‘14 –<br />
Dec ‘14<br />
Jan ‘15 –<br />
Jun ‘15<br />
July ‘15 –<br />
Dec ‘15<br />
Band IA 7 7 8 8 8 7 6<br />
Band IB 4 5 6 6 6 7 5<br />
Band IC 4 5 5 5 5 5 6<br />
Band ID 4 7 5 7 7 6 6<br />
Band IE 6 7 8 8 8 6 8<br />
Band IF 7 10 9 7 6 7 7<br />
No. of Countries 30 30 30 30 30 30 30<br />
Source: Eurostat<br />
In the latest semester, the consumption bands IB was the highest rank<strong>in</strong>g, at fifth most expensive <strong>in</strong> the EU. S<strong>in</strong>ce<br />
the last semester, band IE improved by two places to eight and band IC by one place to sixth, while band ID and IF<br />
rema<strong>in</strong>ed <strong>in</strong> sixth and seventh places respectively.<br />
4.1.5 Bus<strong>in</strong>ess <strong>Electricity</strong> <strong>Prices</strong> – Euro Area Comparison<br />
Among the Euro Area countries, bus<strong>in</strong>ess electricity prices <strong>in</strong> <strong>Ireland</strong> for the second half of 2015 were above or at<br />
the average <strong>in</strong> all bands, rang<strong>in</strong>g from band IA be<strong>in</strong>g at the Euro Area average to bands IB and IC be<strong>in</strong>g 9% above.<br />
Table 28 Bus<strong>in</strong>ess <strong>Electricity</strong> <strong>Prices</strong> (cents) (2 nd semester 2015) – Euro Area Comparison<br />
<strong>Electricity</strong> prices to bus<strong>in</strong>ess consumers<br />
(exclud<strong>in</strong>g VAT)<br />
Price<br />
c/kWh<br />
Relative to Euro Area<br />
average S2 2015<br />
Relative to Euro Area<br />
average S1 2015<br />
Band IA (Consumption < 20 MWh) 20.5 100% 102%<br />
Band IB (20 MWh < Consumption < 500 MWh) 16.4 109% 106%<br />
Band IC (500 MWh < Consumption < 2,000 MWh) 13.6 109% 111%<br />
Band ID (2,000 MWh < Consumption < 20,000 MWh) 11.2 101% 104%<br />
Band IE (20,000 MWh < Consumption < 70,000 MWh) 9.7 102% 106%<br />
Band IF (70,000 MWh < Consumption < 150,000 MWh) 8.8 108% 109%<br />
Source: Eurostat