

Electricity & Gas Prices in Ireland
8fCy301FqPp
8fCy301FqPp

You also want an ePaper? Increase the reach of your titles
YUMPU automatically turns print PDFs into web optimized ePapers that Google loves.
36 ENERGY POLICY STATISTICAL SUPPORT UNIT<br />
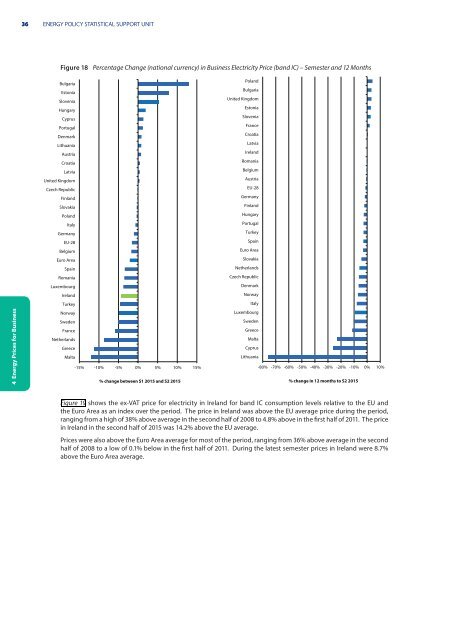
Figure 18 Percentage Change (national currency) <strong>in</strong> Bus<strong>in</strong>ess <strong>Electricity</strong> Price (band IC) – Semester and 12 Months<br />
4 Energy <strong>Prices</strong> for Bus<strong>in</strong>ess<br />
Bulgaria<br />
Estonia<br />
Slovenia<br />
Hungary<br />
Cyprus<br />
Portugal<br />
Denmark<br />
Lithuania<br />
Austria<br />
Croatia<br />
Latvia<br />
United K<strong>in</strong>gdom<br />
Czech Republic<br />
F<strong>in</strong>land<br />
Slovakia<br />
Poland<br />
Italy<br />
Germany<br />
EU-28<br />
Belgium<br />
Euro Area<br />
Spa<strong>in</strong><br />
Romania<br />
Luxembourg<br />
<strong>Ireland</strong><br />
Turkey<br />
Norway<br />
Sweden<br />
France<br />
Netherlands<br />
Greece<br />
Malta<br />
-15% -10% -5% 0% 5% 10% 15%<br />
% change between S1 2015 and S2 2015<br />
Poland<br />
Bulgaria<br />
United K<strong>in</strong>gdom<br />
Estonia<br />
Slovenia<br />
France<br />
Croatia<br />
Latvia<br />
<strong>Ireland</strong><br />
Romania<br />
Belgium<br />
Austria<br />
EU-28<br />
Germany<br />
F<strong>in</strong>land<br />
Hungary<br />
Portugal<br />
Turkey<br />
Spa<strong>in</strong><br />
Euro Area<br />
Slovakia<br />
Netherlands<br />
Czech Republic<br />
Denmark<br />
Norway<br />
Italy<br />
Luxembourg<br />
Sweden<br />
Greece<br />
Malta<br />
Cyprus<br />
Lithuania<br />
-80% -70% -60% -50% -40% -30% -20% -10% 0% 10%<br />
% change <strong>in</strong> 12 months to S2 2015<br />
Figure 19 shows the ex-VAT price for electricity <strong>in</strong> <strong>Ireland</strong> for band IC consumption levels relative to the EU and<br />
the Euro Area as an <strong>in</strong>dex over the period. The price <strong>in</strong> <strong>Ireland</strong> was above the EU average price dur<strong>in</strong>g the period,<br />
rang<strong>in</strong>g from a high of 38% above average <strong>in</strong> the second half of 2008 to 4.8% above <strong>in</strong> the first half of 2011. The price<br />
<strong>in</strong> <strong>Ireland</strong> <strong>in</strong> the second half of 2015 was 14.2% above the EU average.<br />
<strong>Prices</strong> were also above the Euro Area average for most of the period, rang<strong>in</strong>g from 36% above average <strong>in</strong> the second<br />
half of 2008 to a low of 0.1% below <strong>in</strong> the first half of 2011. Dur<strong>in</strong>g the latest semester prices <strong>in</strong> <strong>Ireland</strong> were 8.7%<br />
above the Euro Area average.