

Electricity & Gas Prices in Ireland
8fCy301FqPp
8fCy301FqPp

Create successful ePaper yourself
Turn your PDF publications into a flip-book with our unique Google optimized e-Paper software.
12 ENERGY POLICY STATISTICAL SUPPORT UNIT<br />
all gas traded via the On the Day Commodity Market (OCM) mechanism 9 . This illustrates the trend <strong>in</strong> the wholesale<br />
price of gas and the effect of the currency fluctuation on the price paid <strong>in</strong> <strong>Ireland</strong>. Between the second half of 2009<br />
and the end of 2013 the price of gas <strong>in</strong>creased steadily; on average the price <strong>in</strong> the second half of 2013 was 170%<br />
higher than at the end of 2009 <strong>in</strong> sterl<strong>in</strong>g terms and 181% higher <strong>in</strong> euro terms.<br />
The price of gas fell steadily from February 2015 until April 2016, fall<strong>in</strong>g by 51%. On average the price dur<strong>in</strong>g the<br />
second semester of 2015 (S2 2015) was 16% lower than the first semester of 2015 (S1 2015) <strong>in</strong> sterl<strong>in</strong>g terms and 14%<br />
lower <strong>in</strong> euro terms. Compared the same semester <strong>in</strong> 2014 prices were 18% lower <strong>in</strong> sterl<strong>in</strong>g terms and 9.7% lower<br />
<strong>in</strong> euro terms.<br />
2 <strong>Electricity</strong> and <strong>Gas</strong> <strong>Prices</strong> <strong>in</strong> <strong>Ireland</strong><br />
2.2 Fuel Mix for <strong>Electricity</strong> Generation<br />
The fuel mix for electricity generation has a key bear<strong>in</strong>g on the variation <strong>in</strong> the price of electricity <strong>in</strong> different<br />
countries. This is particularly significant with respect to an electricity fuel mix which relies on <strong>in</strong>ternationally traded<br />
fuels such as gas, oil and coal. Dur<strong>in</strong>g periods of volatile price movements <strong>in</strong> these fuels there is a strong knock-on<br />
impact on electricity prices. Other factors that affect electricity prices <strong>in</strong>clude the level of competition <strong>in</strong> electricity<br />
generation, labour costs, taxation policy and the level of <strong>in</strong>vestment <strong>in</strong> <strong>in</strong>frastructure (i.e. improv<strong>in</strong>g the transmission<br />
and distribution networks).<br />
Figure 4 and Table 5 show the percentage of electricity generation <strong>in</strong> the EU that is fossil fuel based (coal, lignite, peat<br />
oil and gas) and, separately, the proportion of electricity generated from gas and oil.<br />
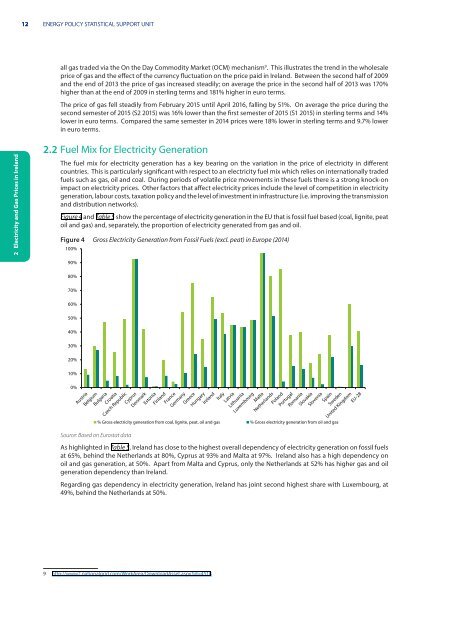
Figure 4 Gross <strong>Electricity</strong> Generation from Fossil Fuels (excl. peat) <strong>in</strong> Europe (2014)<br />
100%<br />
90%<br />
80%<br />
70%<br />
60%<br />
50%<br />
40%<br />
30%<br />
20%<br />
10%<br />
0%<br />
Source: Based on Eurostat data<br />
% Gross electricity generation from coal, lignite, peat, oil and gas % Gross electricity generation from oil and gas<br />
As highlighted <strong>in</strong> Table 5, <strong>Ireland</strong> has close to the highest overall dependency of electricity generation on fossil fuels<br />
at 65%, beh<strong>in</strong>d the Netherlands at 80%, Cyprus at 93% and Malta at 97%. <strong>Ireland</strong> also has a high dependency on<br />
oil and gas generation, at 50%. Apart from Malta and Cyprus, only the Netherlands at 52% has higher gas and oil<br />
generation dependency than <strong>Ireland</strong>.<br />
Regard<strong>in</strong>g gas dependency <strong>in</strong> electricity generation, <strong>Ireland</strong> has jo<strong>in</strong>t second highest share with Luxembourg, at<br />
49%, beh<strong>in</strong>d the Netherlands at 50%.<br />
9 http://www2.nationalgrid.com/WorkArea/DownloadAsset.aspx?id=4518