

Electricity & Gas Prices in Ireland
8fCy301FqPp
8fCy301FqPp

You also want an ePaper? Increase the reach of your titles
YUMPU automatically turns print PDFs into web optimized ePapers that Google loves.
24 ENERGY POLICY STATISTICAL SUPPORT UNIT<br />
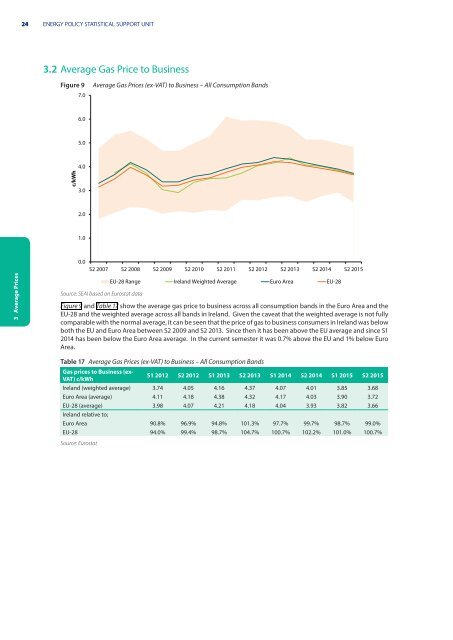
3.2 Average <strong>Gas</strong> Price to Bus<strong>in</strong>ess<br />
Figure 9<br />
7.0<br />
Average <strong>Gas</strong> <strong>Prices</strong> (ex-VAT) to Bus<strong>in</strong>ess – All Consumption Bands<br />
6.0<br />
5.0<br />
4.0<br />
c/kWh<br />
3.0<br />
2.0<br />
1.0<br />
3 Average <strong>Prices</strong><br />
0.0<br />
S2 2007 S2 2008 S2 2009 S2 2010 S2 2011 S2 2012 S2 2013 S2 2014 S2 2015<br />
Source: SEAI based on Eurostat data<br />
EU-28 Range <strong>Ireland</strong> Weighted Average Euro Area EU-28<br />
Figure 9 and Table 17 show the average gas price to bus<strong>in</strong>ess across all consumption bands <strong>in</strong> the Euro Area and the<br />
EU-28 and the weighted average across all bands <strong>in</strong> <strong>Ireland</strong>. Given the caveat that the weighted average is not fully<br />
comparable with the normal average, it can be seen that the price of gas to bus<strong>in</strong>ess consumers <strong>in</strong> <strong>Ireland</strong> was below<br />
both the EU and Euro Area between S2 2009 and S2 2013. S<strong>in</strong>ce then it has been above the EU average and s<strong>in</strong>ce S1<br />
2014 has been below the Euro Area average. In the current semester it was 0.7% above the EU and 1% below Euro<br />
Area.<br />
Table 17 Average <strong>Gas</strong> <strong>Prices</strong> (ex-VAT) to Bus<strong>in</strong>ess – All Consumption Bands<br />
<strong>Gas</strong> prices to Bus<strong>in</strong>ess (ex-<br />
VAT) c/kWh<br />
S1 2012 S2 2012 S1 2013 S2 2013 S1 2014 S2 2014 S1 2015 S2 2015<br />
<strong>Ireland</strong> (weighted average) 3.74 4.05 4.16 4.37 4.07 4.01 3.85 3.68<br />
Euro Area (average) 4.11 4.18 4.38 4.32 4.17 4.03 3.90 3.72<br />
EU-28 (average) 3.98 4.07 4.21 4.18 4.04 3.93 3.82 3.66<br />
<strong>Ireland</strong> relative to;<br />
Euro Area 90.8% 96.9% 94.8% 101.3% 97.7% 99.7% 98.7% 99.0%<br />
EU-28 94.0% 99.4% 98.7% 104.7% 100.7% 102.2% 101.0% 100.7%<br />
Source: Eurostat