

Electricity & Gas Prices in Ireland
8fCy301FqPp
8fCy301FqPp

Create successful ePaper yourself
Turn your PDF publications into a flip-book with our unique Google optimized e-Paper software.
38 ENERGY POLICY STATISTICAL SUPPORT UNIT<br />
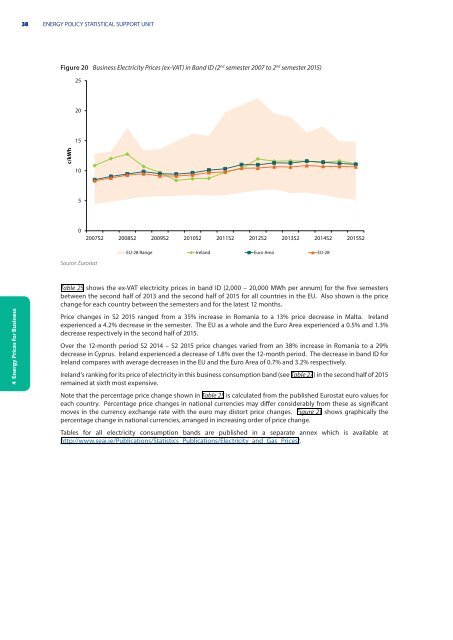
Figure 20 Bus<strong>in</strong>ess <strong>Electricity</strong> <strong>Prices</strong> (ex-VAT) <strong>in</strong> Band ID (2 nd semester 2007 to 2 nd semester 2015)<br />
25<br />
20<br />
15<br />
c/kWh<br />
10<br />
5<br />
0<br />
2007S2 2008S2 2009S2 2010S2 2011S2 2012S2 2013S2 2014S2 2015S2<br />
EU-28 Range <strong>Ireland</strong> Euro Area EU-28<br />
Source: Eurostat<br />
4 Energy <strong>Prices</strong> for Bus<strong>in</strong>ess<br />
Table 25 shows the ex-VAT electricity prices <strong>in</strong> band ID (2,000 – 20,000 MWh per annum) for the five semesters<br />
between the second half of 2013 and the second half of 2015 for all countries <strong>in</strong> the EU. Also shown is the price<br />
change for each country between the semesters and for the latest 12 months.<br />
Price changes <strong>in</strong> S2 2015 ranged from a 35% <strong>in</strong>crease <strong>in</strong> Romania to a 13% price decrease <strong>in</strong> Malta. <strong>Ireland</strong><br />
experienced a 4.2% decrease <strong>in</strong> the semester. The EU as a whole and the Euro Area experienced a 0.5% and 1.3%<br />
decrease respectively <strong>in</strong> the second half of 2015.<br />
Over the 12-month period S2 2014 – S2 2015 price changes varied from an 38% <strong>in</strong>crease <strong>in</strong> Romania to a 29%<br />
decrease <strong>in</strong> Cyprus. <strong>Ireland</strong> experienced a decrease of 1.8% over the 12-month period. The decrease <strong>in</strong> band ID for<br />
<strong>Ireland</strong> compares with average decreases <strong>in</strong> the EU and the Euro Area of 0.7% and 3.2% respectively.<br />
<strong>Ireland</strong>’s rank<strong>in</strong>g for its price of electricity <strong>in</strong> this bus<strong>in</strong>ess consumption band (see Table 27) <strong>in</strong> the second half of 2015<br />
rema<strong>in</strong>ed at sixth most expensive.<br />
Note that the percentage price change shown <strong>in</strong> Table 25 is calculated from the published Eurostat euro values for<br />
each country. Percentage price changes <strong>in</strong> national currencies may differ considerably from these as significant<br />
moves <strong>in</strong> the currency exchange rate with the euro may distort price changes. Figure 21 shows graphically the<br />
percentage change <strong>in</strong> national currencies, arranged <strong>in</strong> <strong>in</strong>creas<strong>in</strong>g order of price change.<br />
Tables for all electricity consumption bands are published <strong>in</strong> a separate annex which is available at<br />
http://www.seai.ie/Publications/Statistics_Publications/<strong>Electricity</strong>_and_<strong>Gas</strong>_<strong>Prices</strong>/.