

Electricity & Gas Prices in Ireland
8fCy301FqPp
8fCy301FqPp

You also want an ePaper? Increase the reach of your titles
YUMPU automatically turns print PDFs into web optimized ePapers that Google loves.
30 ENERGY POLICY STATISTICAL SUPPORT UNIT<br />
Table 26).<br />
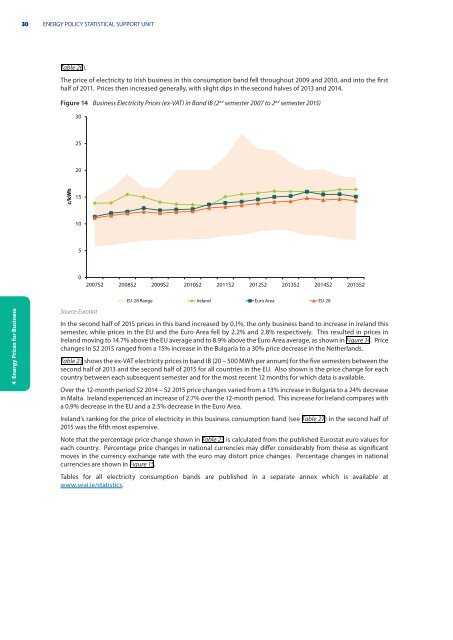
The price of electricity to Irish bus<strong>in</strong>ess <strong>in</strong> this consumption band fell throughout 2009 and 2010, and <strong>in</strong>to the first<br />
half of 2011. <strong>Prices</strong> then <strong>in</strong>creased generally, with slight dips <strong>in</strong> the second halves of 2013 and 2014.<br />
Figure 14 Bus<strong>in</strong>ess <strong>Electricity</strong> <strong>Prices</strong> (ex-VAT) <strong>in</strong> Band IB (2 nd semester 2007 to 2 nd semester 2015)<br />
30<br />
25<br />
20<br />
c/kWh<br />
15<br />
10<br />
5<br />
0<br />
2007S2 2008S2 2009S2 2010S2 2011S2 2012S2 2013S2 2014S2 2015S2<br />
EU-28 Range <strong>Ireland</strong> Euro Area EU-28<br />
4 Energy <strong>Prices</strong> for Bus<strong>in</strong>ess<br />
Source: Eurostat<br />
In the second half of 2015 prices <strong>in</strong> this band <strong>in</strong>creased by 0.1%, the only bus<strong>in</strong>ess band to <strong>in</strong>crease <strong>in</strong> <strong>Ireland</strong> this<br />
semester, while prices <strong>in</strong> the EU and the Euro Area fell by 2.2% and 2.8% respectively. This resulted <strong>in</strong> prices <strong>in</strong><br />
<strong>Ireland</strong> mov<strong>in</strong>g to 14.7% above the EU average and to 8.9% above the Euro Area average, as shown <strong>in</strong> Figure 14. Price<br />
changes <strong>in</strong> S2 2015 ranged from a 15% <strong>in</strong>crease <strong>in</strong> the Bulgaria to a 30% price decrease <strong>in</strong> the Netherlands.<br />
Table 23 shows the ex-VAT electricity prices <strong>in</strong> band IB (20 – 500 MWh per annum) for the five semesters between the<br />
second half of 2013 and the second half of 2015 for all countries <strong>in</strong> the EU. Also shown is the price change for each<br />
country between each subsequent semester and for the most recent 12 months for which data is available.<br />
Over the 12-month period S2 2014 – S2 2015 price changes varied from a 13% <strong>in</strong>crease <strong>in</strong> Bulgaria to a 24% decrease<br />
<strong>in</strong> Malta. <strong>Ireland</strong> experienced an <strong>in</strong>crease of 2.7% over the 12-month period. This <strong>in</strong>crease for <strong>Ireland</strong> compares with<br />
a 0.9% decrease <strong>in</strong> the EU and a 2.5% decrease <strong>in</strong> the Euro Area.<br />
<strong>Ireland</strong>’s rank<strong>in</strong>g for the price of electricity <strong>in</strong> this bus<strong>in</strong>ess consumption band (see Table 27) <strong>in</strong> the second half of<br />
2015 was the fifth most expensive.<br />
Note that the percentage price change shown <strong>in</strong> Table 23 is calculated from the published Eurostat euro values for<br />
each country. Percentage price changes <strong>in</strong> national currencies may differ considerably from these as significant<br />
moves <strong>in</strong> the currency exchange rate with the euro may distort price changes. Percentage changes <strong>in</strong> national<br />
currencies are shown <strong>in</strong> Figure 15.<br />
Tables for all electricity consumption bands are published <strong>in</strong> a separate annex which is available at<br />
www.seai.ie/statistics.