

BK Perspective Real Estate USA 2016

Create successful ePaper yourself
Turn your PDF publications into a flip-book with our unique Google optimized e-Paper software.
<strong>Perspective</strong> on <strong>Real</strong> <strong>Estate</strong> <strong>2016</strong> - U.S.<br />
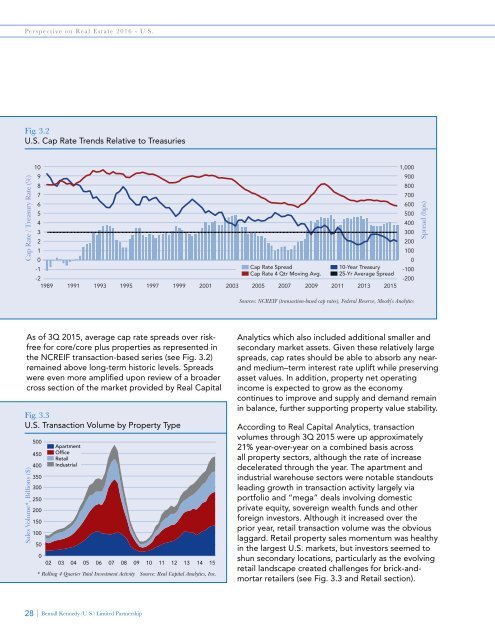
Fig. 3.2<br />
U.S. Cap Rate Trends Relative to Treasuries<br />
Cap Rate / Treasury Rate (%)<br />
10<br />
1,000<br />
9<br />
900<br />
8<br />
800<br />
7<br />
700<br />
6<br />
600<br />
5<br />
500<br />
4<br />
400<br />
3<br />
300<br />
2<br />
200<br />
1<br />
100<br />
0<br />
0<br />
-1<br />
Cap Rate Spread<br />
10-Year Treasury -100<br />
Cap Rate 4 Qtr Moving Avg. 25-Yr Average Spread<br />
-2<br />
-200<br />
1989 1991 1993 1995 1997 1999 2001 2003 2005 2007 2009 2011 2013 2015<br />
Spread (bps)<br />
Sources: NCREIF (transaction-based cap rates), Federal Reserve, Moody's Analytics<br />
As of 3Q 2015, average cap rate spreads over riskfree<br />
for core/core plus properties as represented in<br />
the NCREIF transaction-based series (see Fig. 3.2)<br />
remained above long-term historic levels. Spreads<br />
were even more amplified upon review of a broader<br />
cross section of the market provided by <strong>Real</strong> Capital<br />
Fig. 3.3<br />
U.S. Transaction Volume by Property Type<br />
Sales Volume*, Billions ($)<br />
500<br />
450<br />
400<br />
350<br />
300<br />
250<br />
200<br />
150<br />
100<br />
50<br />
0<br />
Apartment<br />
Office<br />
Retail<br />
Industrial<br />
02 03 04 05 06 07 08 09 10 11 12 13 14 15<br />
* Rolling 4 Quarter Total Investment Activity<br />
Source: <strong>Real</strong> Capital Analytics, Inc.<br />
Analytics which also included additional smaller and<br />
secondary market assets. Given these relatively large<br />
spreads, cap rates should be able to absorb any nearand<br />
medium–term interest rate uplift while preserving<br />
asset values. In addition, property net operating<br />
income is expected to grow as the economy<br />
continues to improve and supply and demand remain<br />
in balance, further supporting property value stability.<br />
According to <strong>Real</strong> Capital Analytics, transaction<br />
volumes through 3Q 2015 were up approximately<br />
21% year-over-year on a combined basis across<br />
all property sectors, although the rate of increase<br />
decelerated through the year. The apartment and<br />
industrial warehouse sectors were notable standouts<br />
leading growth in transaction activity largely via<br />
portfolio and “mega” deals involving domestic<br />
private equity, sovereign wealth funds and other<br />
foreign investors. Although it increased over the<br />
prior year, retail transaction volume was the obvious<br />
laggard. Retail property sales momentum was healthy<br />
in the largest U.S. markets, but investors seemed to<br />
shun secondary locations, particularly as the evolving<br />
retail landscape created challenges for brick-andmortar<br />
retailers (see Fig. 3.3 and Retail section).<br />
28 | Bentall Kennedy (U.S.) Limited Partnership