

BK Perspective Real Estate USA 2016

Create successful ePaper yourself
Turn your PDF publications into a flip-book with our unique Google optimized e-Paper software.
<strong>Perspective</strong> on <strong>Real</strong> <strong>Estate</strong> <strong>2016</strong> - U.S.<br />
Office<br />
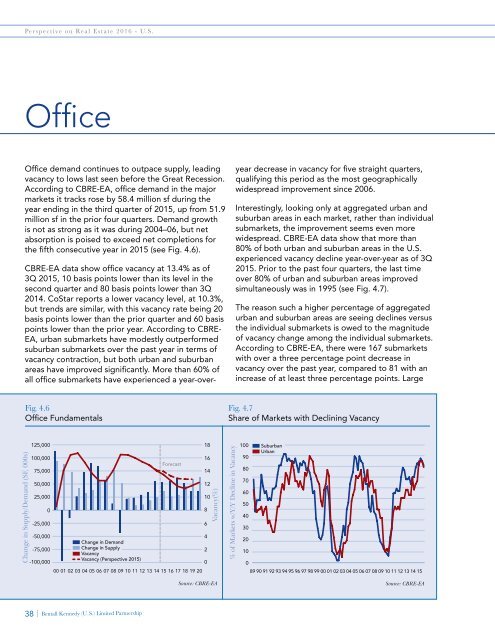
Office demand continues to outpace supply, leading<br />
vacancy to lows last seen before the Great Recession.<br />
According to CBRE-EA, office demand in the major<br />
markets it tracks rose by 58.4 million sf during the<br />
year ending in the third quarter of 2015, up from 51.9<br />
million sf in the prior four quarters. Demand growth<br />
is not as strong as it was during 2004–06, but net<br />
absorption is poised to exceed net completions for<br />
the fifth consecutive year in 2015 (see Fig. 4.6).<br />
CBRE-EA data show office vacancy at 13.4% as of<br />
3Q 2015, 10 basis points lower than its level in the<br />
second quarter and 80 basis points lower than 3Q<br />
2014. CoStar reports a lower vacancy level, at 10.3%,<br />
but trends are similar, with this vacancy rate being 20<br />
basis points lower than the prior quarter and 60 basis<br />
points lower than the prior year. According to CBRE-<br />
EA, urban submarkets have modestly outperformed<br />
suburban submarkets over the past year in terms of<br />
vacancy contraction, but both urban and suburban<br />
areas have improved significantly. More than 60% of<br />
all office submarkets have experienced a year-overyear<br />
decrease in vacancy for five straight quarters,<br />
qualifying this period as the most geographically<br />
widespread improvement since 2006.<br />
Interestingly, looking only at aggregated urban and<br />
suburban areas in each market, rather than individual<br />
submarkets, the improvement seems even more<br />
widespread. CBRE-EA data show that more than<br />
80% of both urban and suburban areas in the U.S.<br />
experienced vacancy decline year-over-year as of 3Q<br />
2015. Prior to the past four quarters, the last time<br />
over 80% of urban and suburban areas improved<br />
simultaneously was in 1995 (see Fig. 4.7).<br />
The reason such a higher percentage of aggregated<br />
urban and suburban areas are seeing declines versus<br />
the individual submarkets is owed to the magnitude<br />
of vacancy change among the individual submarkets.<br />
According to CBRE-EA, there were 167 submarkets<br />
with over a three percentage point decrease in<br />
vacancy over the past year, compared to 81 with an<br />
increase of at least three percentage points. Large<br />
Fig. 4.6<br />
Office Fundamentals<br />
Fig. 4.7<br />
Share of Markets with Declining Vacancy<br />
Change in Supply/Demand (SF, 000s)<br />
125,000<br />
100,000<br />
75,000<br />
50,000<br />
25,000<br />
0<br />
-25,000<br />
Forecast<br />
-50,000<br />
4<br />
Change in Demand<br />
-75,000<br />
Change in Supply<br />
Vacancy<br />
2<br />
-100,000<br />
Vacancy (<strong>Perspective</strong> 2015)<br />
0<br />
00 01 02 03 04 05 06 07 08 09 10 11 12 13 14 15 16 17 18 19 20<br />
18<br />
16<br />
14<br />
12<br />
10<br />
8<br />
6<br />
Vacancy(%)<br />
Source: CBRE-EA<br />
% of Markets w/Y/Y Decline in Vacancy<br />
100<br />
90<br />
80<br />
70<br />
60<br />
50<br />
40<br />
30<br />
20<br />
10<br />
0<br />
Suburban<br />
Urban<br />
89 90 91 92 93 94 95 96 97 98 99 00 01 02 03 04 05 06 07 08 09 10 11 12 13 14 15<br />
Source: CBRE-EA<br />
38 | Bentall Kennedy (U.S.) Limited Partnership