

BK Perspective Real Estate USA 2016

Create successful ePaper yourself
Turn your PDF publications into a flip-book with our unique Google optimized e-Paper software.
<strong>Perspective</strong> on <strong>Real</strong> <strong>Estate</strong> <strong>2016</strong> - U.S.<br />
Apartment<br />
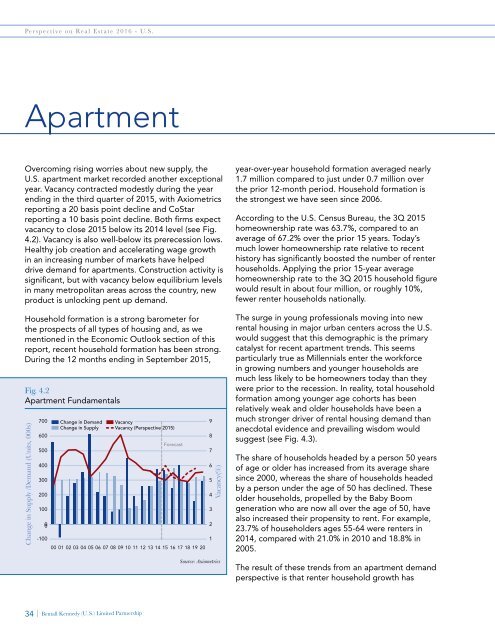
Overcoming rising worries about new supply, the<br />
U.S. apartment market recorded another exceptional<br />
year. Vacancy contracted modestly during the year<br />
ending in the third quarter of 2015, with Axiometrics<br />
reporting a 20 basis point decline and CoStar<br />
reporting a 10 basis point decline. Both firms expect<br />
vacancy to close 2015 below its 2014 level (see Fig.<br />
4.2). Vacancy is also well-below its prerecession lows.<br />
Healthy job creation and accelerating wage growth<br />
in an increasing number of markets have helped<br />
drive demand for apartments. Construction activity is<br />
significant, but with vacancy below equilibrium levels<br />
in many metropolitan areas across the country, new<br />
product is unlocking pent up demand.<br />
Household formation is a strong barometer for<br />
the prospects of all types of housing and, as we<br />
mentioned in the Economic Outlook section of this<br />
report, recent household formation has been strong.<br />
During the 12 months ending in September 2015,<br />
Fig. 4.2<br />
Apartment Fundamentals<br />
Change in Supply /Demand (Units, 000s)<br />
700<br />
600<br />
500<br />
400<br />
300<br />
200<br />
100<br />
0<br />
-100<br />
00<br />
Change in Demand<br />
Change in Supply<br />
Vacancy<br />
Vacancy (<strong>Perspective</strong> 2015)<br />
Forecast<br />
01 02 03 04 05 06 07 08 09 10 11 12 13 14 15 16 17 18 19 20<br />
9<br />
8<br />
7<br />
6<br />
5<br />
4<br />
3<br />
2<br />
1<br />
Vacancy(%)<br />
Source: Axiometrics<br />
year-over-year household formation averaged nearly<br />
1.7 million compared to just under 0.7 million over<br />
the prior 12-month period. Household formation is<br />
the strongest we have seen since 2006.<br />
According to the U.S. Census Bureau, the 3Q 2015<br />
homeownership rate was 63.7%, compared to an<br />
average of 67.2% over the prior 15 years. Today’s<br />
much lower homeownership rate relative to recent<br />
history has significantly boosted the number of renter<br />
households. Applying the prior 15-year average<br />
homeownership rate to the 3Q 2015 household figure<br />
would result in about four million, or roughly 10%,<br />
fewer renter households nationally.<br />
The surge in young professionals moving into new<br />
rental housing in major urban centers across the U.S.<br />
would suggest that this demographic is the primary<br />
catalyst for recent apartment trends. This seems<br />
particularly true as Millennials enter the workforce<br />
in growing numbers and younger households are<br />
much less likely to be homeowners today than they<br />
were prior to the recession. In reality, total household<br />
formation among younger age cohorts has been<br />
relatively weak and older households have been a<br />
much stronger driver of rental housing demand than<br />
anecdotal evidence and prevailing wisdom would<br />
suggest (see Fig. 4.3).<br />
The share of households headed by a person 50 years<br />
of age or older has increased from its average share<br />
since 2000, whereas the share of households headed<br />
by a person under the age of 50 has declined. These<br />
older households, propelled by the Baby Boom<br />
generation who are now all over the age of 50, have<br />
also increased their propensity to rent. For example,<br />
23.7% of householders ages 55-64 were renters in<br />
2014, compared with 21.0% in 2010 and 18.8% in<br />
2005.<br />
The result of these trends from an apartment demand<br />
perspective is that renter household growth has<br />
34 | Bentall Kennedy (U.S.) Limited Partnership