

BK Perspective Real Estate USA 2016

You also want an ePaper? Increase the reach of your titles
YUMPU automatically turns print PDFs into web optimized ePapers that Google loves.
<strong>Perspective</strong> on <strong>Real</strong> <strong>Estate</strong> <strong>2016</strong> - U.S.<br />
Industrial<br />
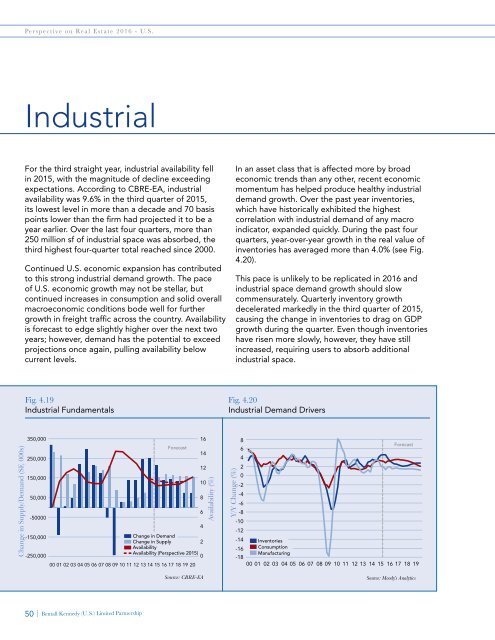
For the third straight year, industrial availability fell<br />
in 2015, with the magnitude of decline exceeding<br />
expectations. According to CBRE-EA, industrial<br />
availability was 9.6% in the third quarter of 2015,<br />
its lowest level in more than a decade and 70 basis<br />
points lower than the firm had projected it to be a<br />
year earlier. Over the last four quarters, more than<br />
250 million sf of industrial space was absorbed, the<br />
third highest four-quarter total reached since 2000.<br />
Continued U.S. economic expansion has contributed<br />
to this strong industrial demand growth. The pace<br />
of U.S. economic growth may not be stellar, but<br />
continued increases in consumption and solid overall<br />
macroeconomic conditions bode well for further<br />
growth in freight traffic across the country. Availability<br />
is forecast to edge slightly higher over the next two<br />
years; however, demand has the potential to exceed<br />
projections once again, pulling availability below<br />
current levels.<br />
In an asset class that is affected more by broad<br />
economic trends than any other, recent economic<br />
momentum has helped produce healthy industrial<br />
demand growth. Over the past year inventories,<br />
which have historically exhibited the highest<br />
correlation with industrial demand of any macro<br />
indicator, expanded quickly. During the past four<br />
quarters, year-over-year growth in the real value of<br />
inventories has averaged more than 4.0% (see Fig.<br />
4.20).<br />
This pace is unlikely to be replicated in <strong>2016</strong> and<br />
industrial space demand growth should slow<br />
commensurately. Quarterly inventory growth<br />
decelerated markedly in the third quarter of 2015,<br />
causing the change in inventories to drag on GDP<br />
growth during the quarter. Even though inventories<br />
have risen more slowly, however, they have still<br />
increased, requiring users to absorb additional<br />
industrial space.<br />
Fig. 4.19<br />
Industrial Fundamentals<br />
Fig. 4.20<br />
Industrial Demand Drivers<br />
Change in Supply/Demand (SF, 000s)<br />
350,000<br />
250,000<br />
150,000<br />
50,000<br />
-50000<br />
-150,000<br />
-250,000<br />
Forecast<br />
16<br />
14<br />
12<br />
10<br />
4<br />
Change in Demand<br />
Change in Supply<br />
2<br />
Availability<br />
Availability (<strong>Perspective</strong> 2015)<br />
0<br />
00 01 02 03 04 05 06 07 08 09 10 11 12 13 14 15 16 17 18 19 20<br />
8<br />
6<br />
Availability (%)<br />
Y/Y Change (%)<br />
8<br />
Forecast<br />
6<br />
4<br />
2<br />
0<br />
-2<br />
-4<br />
-6<br />
-8<br />
-10<br />
-12<br />
-14 Inventories<br />
-16 Consumption<br />
Manufacturing<br />
-18<br />
00 01 02 03 04 05 06 07 08 09 10 11 12 13 14 15 16 17 18 19<br />
Source: CBRE-EA<br />
Source: Moody's Analytics<br />
50 | Bentall Kennedy (U.S.) Limited Partnership