

BK Perspective Real Estate USA 2016

You also want an ePaper? Increase the reach of your titles
YUMPU automatically turns print PDFs into web optimized ePapers that Google loves.
<strong>Perspective</strong> on <strong>Real</strong> <strong>Estate</strong> <strong>2016</strong> - U.S.<br />
Apartment<br />
Demand Growth* (%)<br />
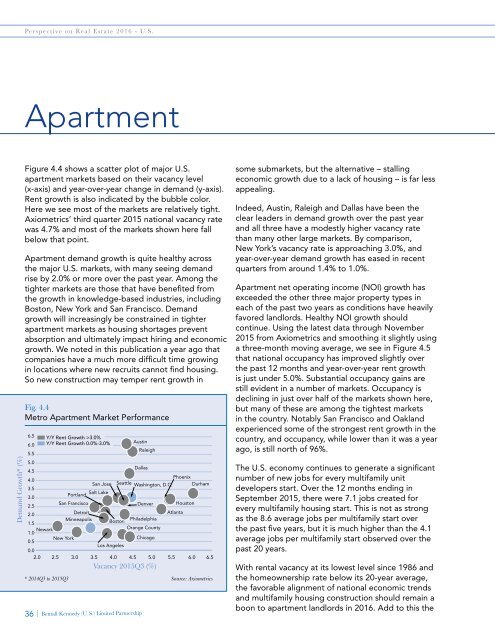
Figure 4.4 shows a scatter plot of major U.S.<br />
apartment markets based on their vacancy level<br />
(x-axis) and year-over-year change in demand (y-axis).<br />
Rent growth is also indicated by the bubble color.<br />
Here we see most of the markets are relatively tight.<br />
Axiometrics’ third quarter 2015 national vacancy rate<br />
was 4.7% and most of the markets shown here fall<br />
below that point.<br />
Apartment demand growth is quite healthy across<br />
the major U.S. markets, with many seeing demand<br />
rise by 2.0% or more over the past year. Among the<br />
tighter markets are those that have benefited from<br />
the growth in knowledge-based industries, including<br />
Boston, New York and San Francisco. Demand<br />
growth will increasingly be constrained in tighter<br />
apartment markets as housing shortages prevent<br />
absorption and ultimately impact hiring and economic<br />
growth. We noted in this publication a year ago that<br />
companies have a much more difficult time growing<br />
in locations where new recruits cannot find housing.<br />
So new construction may temper rent growth in<br />
Fig. 4.4<br />
Metro Apartment Market Performance<br />
5.5<br />
6.5 Y/Y Rent Growth >3.0%<br />
6.0 Y/Y Rent Growth 0.0%-3.0% Austin<br />
Raleigh<br />
5.0<br />
4.5<br />
Dallas<br />
Phoenix<br />
4.0<br />
San Jose Seattle Washington, D.C. Durham<br />
3.5<br />
Portland<br />
Salt Lake<br />
3.0<br />
2.5<br />
2.0<br />
San Francisco<br />
Detroit<br />
Denver Houston<br />
Atlanta<br />
1.5<br />
Minneapolis Boston<br />
Philadelphia<br />
Newark<br />
Orange County<br />
1.0<br />
0.5<br />
New York<br />
Chicago<br />
Los Angeles<br />
0.0<br />
2.0 2.5 3.0 3.5 4.0 4.5 5.0 5.5 6.0 6.5<br />
* 2014Q3 to 2015Q3<br />
Vacancy 2015Q3 (%)<br />
36 | Bentall Kennedy (U.S.) Limited Partnership<br />
Source: Axiometrics<br />
some submarkets, but the alternative – stalling<br />
economic growth due to a lack of housing – is far less<br />
appealing.<br />
Indeed, Austin, Raleigh and Dallas have been the<br />
clear leaders in demand growth over the past year<br />
and all three have a modestly higher vacancy rate<br />
than many other large markets. By comparison,<br />
New York’s vacancy rate is approaching 3.0%, and<br />
year-over-year demand growth has eased in recent<br />
quarters from around 1.4% to 1.0%.<br />
Apartment net operating income (NOI) growth has<br />
exceeded the other three major property types in<br />
each of the past two years as conditions have heavily<br />
favored landlords. Healthy NOI growth should<br />
continue. Using the latest data through November<br />
2015 from Axiometrics and smoothing it slightly using<br />
a three-month moving average, we see in Figure 4.5<br />
that national occupancy has improved slightly over<br />
the past 12 months and year-over-year rent growth<br />
is just under 5.0%. Substantial occupancy gains are<br />
still evident in a number of markets. Occupancy is<br />
declining in just over half of the markets shown here,<br />
but many of these are among the tightest markets<br />
in the country. Notably San Francisco and Oakland<br />
experienced some of the strongest rent growth in the<br />
country, and occupancy, while lower than it was a year<br />
ago, is still north of 96%.<br />
The U.S. economy continues to generate a significant<br />
number of new jobs for every multifamily unit<br />
developers start. Over the 12 months ending in<br />
September 2015, there were 7.1 jobs created for<br />
every multifamily housing start. This is not as strong<br />
as the 8.6 average jobs per multifamily start over<br />
the past five years, but it is much higher than the 4.1<br />
average jobs per multifamily start observed over the<br />
past 20 years.<br />
With rental vacancy at its lowest level since 1986 and<br />
the homeownership rate below its 20-year average,<br />
the favorable alignment of national economic trends<br />
and multifamily housing construction should remain a<br />
boon to apartment landlords in <strong>2016</strong>. Add to this the