

BK Perspective Real Estate USA 2016

Create successful ePaper yourself
Turn your PDF publications into a flip-book with our unique Google optimized e-Paper software.
<strong>Perspective</strong> on <strong>Real</strong> <strong>Estate</strong> <strong>2016</strong> - U.S.<br />
Office<br />
urban submarkets with at least five million sf that<br />
experienced rising occupancy rates (1.6 percentage<br />
points on average) and seven that experienced falling<br />
occupancy rates (1.4 percentage points on average).<br />
On the whole occupancy rose slightly in New York’s<br />
urban submarkets and while the current occupancy<br />
rate is lower than the 95.0%+ cyclical highs<br />
observed in 2007, it is on a par with 2005, indicating<br />
fundamentals are quite healthy.<br />
As discussed in the economic section of this<br />
publication, the U.S. continues to benefit from solid<br />
job creation. These trends have been particularly<br />
positive in office-using sectors. In <strong>Perspective</strong> 2015<br />
we highlighted how the professional, scientific and<br />
technical services subsector of professional and<br />
business services had risen in prominence and was<br />
a major driver of office market gains. This sector<br />
includes most of the jobs commonly associated with<br />
science, technology, engineering and math (STEM)<br />
and technology, advertising, media and information<br />
(TAMI) fields. The performance of this subsector<br />
has only improved over the past year, with growth<br />
accelerating and becoming more evident across its<br />
various components.<br />
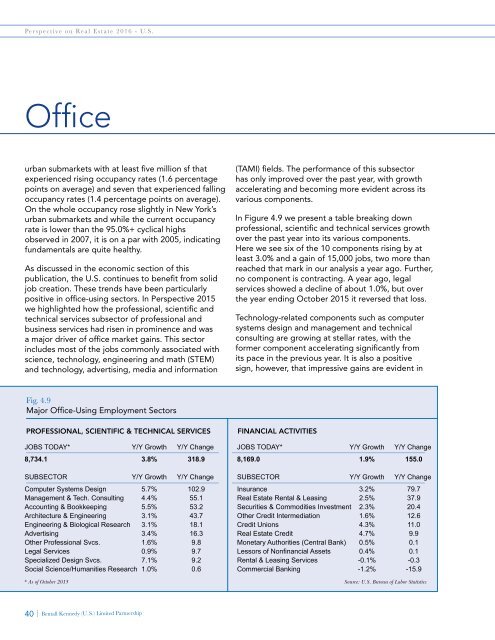
In Figure 4.9 we present a table breaking down<br />
professional, scientific and technical services growth<br />
over the past year into its various components.<br />
Here we see six of the 10 components rising by at<br />
least 3.0% and a gain of 15,000 jobs, two more than<br />
reached that mark in our analysis a year ago. Further,<br />
no component is contracting. A year ago, legal<br />
services showed a decline of about 1.0%, but over<br />
the year ending October 2015 it reversed that loss.<br />
Technology-related components such as computer<br />
systems design and management and technical<br />
consulting are growing at stellar rates, with the<br />
former component accelerating significantly from<br />
its pace in the previous year. It is also a positive<br />
sign, however, that impressive gains are evident in<br />
Fig. 4.9<br />
Major Office-Using Employment Sectors<br />
PROFESSIONAL, SCIENTIFIC & TECHNICAL SERVICES<br />
JOBS TODAY* Y/Y Growth Y/Y Change<br />
8,734.1 3.8% 318.9<br />
SUBSECTOR Y/Y Growth Y/Y Change<br />
Computer Systems Design 5.7% 102.9<br />
Management & Tech. Consulting 4.4% 55.1<br />
Accounting & Bookkeeping 5.5% 53.2<br />
Architecture & Engineering 3.1% 43.7<br />
Engineering & Biological Research 3.1% 18.1<br />
Advertising 3.4% 16.3<br />
Other Professional Svcs. 1.6% 9.8<br />
Legal Services 0.9% 9.7<br />
Specialized Design Svcs. 7.1% 9.2<br />
Social Science/Humanities Research 1.0% 0.6<br />
FINANCIAL ACTIVITIES<br />
JOBS TODAY* Y/Y Growth Y/Y Change<br />
8,169.0 1.9% 155.0<br />
SUBSECTOR Y/Y Growth Y/Y Change<br />
Insurance 3.2% 79.7<br />
<strong>Real</strong> <strong>Estate</strong> Rental & Leasing 2.5% 37.9<br />
Securities & Commodities Investment 2.3% 20.4<br />
Other Credit Intermediation 1.6% 12.6<br />
Credit Unions 4.3% 11.0<br />
<strong>Real</strong> <strong>Estate</strong> Credit 4.7% 9.9<br />
Monetary Authorities (Central Bank) 0.5% 0.1<br />
Lessors of Nonfinancial Assets 0.4% 0.1<br />
Rental & Leasing Services -0.1% -0.3<br />
Commercial Banking -1.2% -15.9<br />
* As of October 2015 Source: U.S. Bureau of Labor Statistics<br />
40 | Bentall Kennedy (U.S.) Limited Partnership