

AGENCY/PHOTOGRAPHER
RaisingWagesRebuildingWealth
RaisingWagesRebuildingWealth

You also want an ePaper? Increase the reach of your titles
YUMPU automatically turns print PDFs into web optimized ePapers that Google loves.
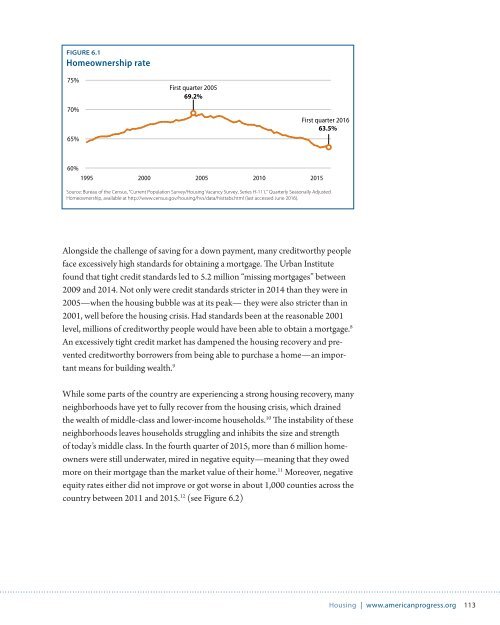
FIGURE 6.1<br />
Homeownership rate<br />
75%<br />
70%<br />
65%<br />
First quarter 2005<br />
69.2%<br />
First quarter 2016<br />
63.5%<br />
60%<br />
1995 2000 2005 2010 2015<br />
Source: Bureau of the Census, "Current Population Survey/Housing Vacancy Survey, Series H-111," Quarterly Seasonally Adjusted<br />
Homeownership, available at http://www.census.gov/housing/hvs/data/histtabs.html (last accessed June 2016).<br />
Alongside the challenge of saving for a down payment, many creditworthy people<br />
face excessively high standards for obtaining a mortgage. The Urban Institute<br />
found that tight credit standards led to 5.2 million “missing mortgages” between<br />
2009 and 2014. Not only were credit standards stricter in 2014 than they were in<br />
2005—when the housing bubble was at its peak— they were also stricter than in<br />
2001, well before the housing crisis. Had standards been at the reasonable 2001<br />
level, millions of creditworthy people would have been able to obtain a mortgage. 8<br />
An excessively tight credit market has dampened the housing recovery and prevented<br />
creditworthy borrowers from being able to purchase a home—an important<br />
means for building wealth. 9<br />
While some parts of the country are experiencing a strong housing recovery, many<br />
neighborhoods have yet to fully recover from the housing crisis, which drained<br />
the wealth of middle-class and lower-income households. 10 The instability of these<br />
neighborhoods leaves households struggling and inhibits the size and strength<br />
of today’s middle class. In the fourth quarter of 2015, more than 6 million homeowners<br />
were still underwater, mired in negative equity—meaning that they owed<br />
more on their mortgage than the market value of their home. 11 Moreover, negative<br />
equity rates either did not improve or got worse in about 1,000 counties across the<br />
country between 2011 and 2015. 12 (see Figure 6.2)<br />
Housing | www.americanprogress.org 113