

AGENCY/PHOTOGRAPHER
RaisingWagesRebuildingWealth
RaisingWagesRebuildingWealth

You also want an ePaper? Increase the reach of your titles
YUMPU automatically turns print PDFs into web optimized ePapers that Google loves.
information available to parents. 25 While this was an important and necessary<br />
step forward, the reauthorization did not include new funding beyond basic<br />
health and safety protections. 26 Without new resources directed to quality programs<br />
that exceed minimum standards, families will continue to experience high<br />
costs and low quality.<br />
Federal resources to support preschool access are similarly limited. Nearly all<br />
states serve at least some children in public preschool, but nationally, just 29<br />
percent of 4-year-olds and 5 percent of 3-year-olds receive services, due to funding<br />
limitations. 27 Only a handful of states—including Georgia and Oklahoma—have<br />
prioritized enough funding for preschool to serve a majority of 4-year-olds. 28<br />
The quality of child care and preschool can vary across states as well. Florida,<br />
for instance, serves a larger portion of 4-year-olds than any other state but fails<br />
to meet widely recognized and research-based quality standards such as teacher<br />
training and education. 29 Inconsistent quality across states and a lack of federal<br />
investment means that most families are left to find preschool on their own. The<br />
majority of programs are rated as mediocre, and children from higher-income<br />
families are more likely to attend high-quality preschools. 30<br />
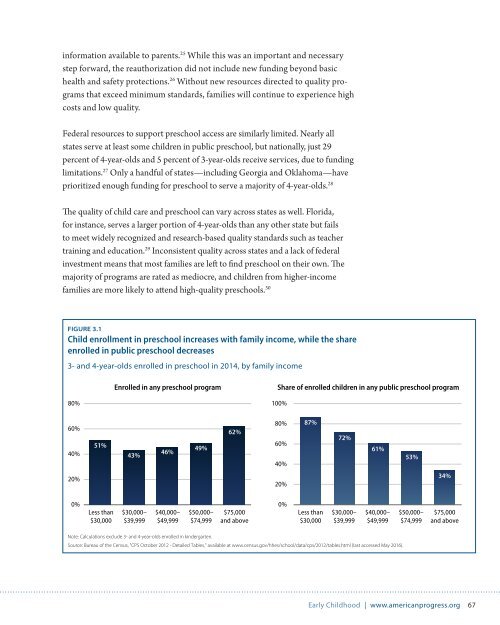
FIGURE 3.1<br />
Child enrollment in preschool increases with family income, while the share<br />
enrolled in public preschool decreases<br />
3- and 4-year-olds enrolled in preschool in 2014, by family income<br />
Enrolled in any preschool program<br />
Share of enrolled children in any public preschool program<br />
80%<br />
100%<br />
60%<br />
40%<br />
51%<br />
43%<br />
46%<br />
49%<br />
62%<br />
80%<br />
60%<br />
40%<br />
87%<br />
72%<br />
61%<br />
53%<br />
20%<br />
20%<br />
34%<br />
0%<br />
Less than<br />
$30,000<br />
$30,000–<br />
$39,999<br />
$40,000–<br />
$49,999<br />
$50,000–<br />
$74,999<br />
$75,000<br />
and above<br />
0%<br />
Less than<br />
$30,000<br />
$30,000–<br />
$39,999<br />
$40,000–<br />
$49,999<br />
$50,000–<br />
$74,999<br />
$75,000<br />
and above<br />
Note: Calculations exclude 3- and 4-year-olds enrolled in kindergarten.<br />
Source: Bureau of the Census, "CPS October 2012 - Detailed Tables," available at www.census.gov/hhes/school/data/cps/2012/tables.html (last accessed May 2016).<br />
Early Childhood | www.americanprogress.org 67