

Spencer Stuart Board Index
2ipnQXb
2ipnQXb

You also want an ePaper? Increase the reach of your titles
YUMPU automatically turns print PDFs into web optimized ePapers that Google loves.
Small number of boards provide extra compensation for special<br />
committee service<br />
»»<br />
Seven boards (1%) reported providing additional compensation to directors serving on a special<br />
committee. Supplemental retainers for service on special committees ranged in amounts from<br />
$10,000 to $22,500.<br />
»»<br />
Among boards that disclosed the purposes of the special committees, reasons included: addressing<br />
shareholder demands (three boards), CEO search or succession planning (one board), overseeing<br />
equity investments (one board), SEC and internal investigation (one board), and mergers and<br />
acquisitions (one board).<br />
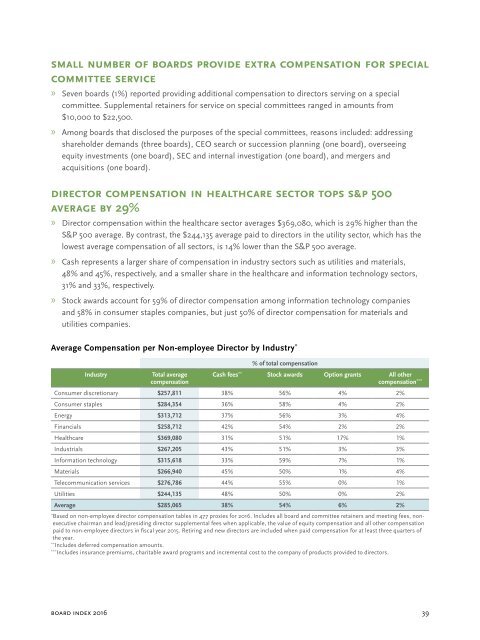
Director compensation in healthcare sector tops S&P 500<br />
average by 29%<br />
»<br />
» Director compensation within the healthcare sector averages $369,080, which is 29% higher than the<br />
S&P 500 average. By contrast, the $244,135 average paid to directors in the utility sector, which has the<br />
lowest average compensation of all sectors, is 14% lower than the S&P 500 average.<br />
»»<br />
Cash represents a larger share of compensation in industry sectors such as utilities and materials,<br />
48% and 45%, respectively, and a smaller share in the healthcare and information technology sectors,<br />
31% and 33%, respectively.<br />
»»<br />
Stock awards account for 59% of director compensation among information technology companies<br />
and 58% in consumer staples companies, but just 50% of director compensation for materials and<br />
utilities companies.<br />
Average Compensation per Non-employee Director by Industry *<br />
% of total compensation<br />
Industry<br />
Total average<br />
compensation<br />
Cash fees ** Stock awards Option grants All other<br />
compensation ***<br />
Consumer discretionary $257,811 38% 56% 4% 2%<br />
Consumer staples $284,354 36% 58% 4% 2%<br />
Energy $313,712 37% 56% 3% 4%<br />
Financials $258,712 42% 54% 2% 2%<br />
Healthcare $369,080 31% 51% 17% 1%<br />
Industrials $267,205 43% 51% 3% 3%<br />
Information technology $315,618 33% 59% 7% 1%<br />
Materials $266,940 45% 50% 1% 4%<br />
Telecommunication services $276,786 44% 55% 0% 1%<br />
Utilities $244,135 48% 50% 0% 2%<br />
Average $285,065 38% 54% 6% 2%<br />
*<br />
Based on non-employee director compensation tables in 477 proxies for 2016. Includes all board and committee retainers and meeting fees, nonexecutive<br />
chairman and lead/presiding director supplemental fees when applicable, the value of equity compensation and all other compensation<br />
paid to non-employee directors in fiscal year 2015. Retiring and new directors are included when paid compensation for at least three quarters of<br />
the year.<br />
**<br />
Includes deferred compensation amounts.<br />
***<br />
Includes insurance premiums, charitable award programs and incremental cost to the company of products provided to directors.<br />
board index 2016 39