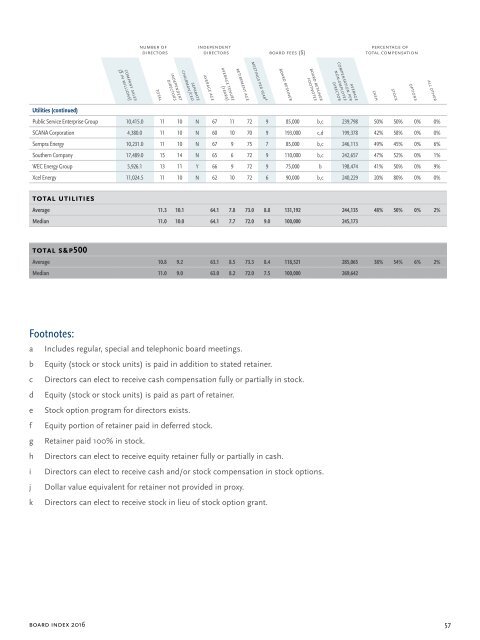
Comparative <strong>Board</strong> Data number of directors independent directors <strong>Board</strong> fees ($) Percentage of total compensation AVERAGE COMPENSATION PER NON-EMPLOYEE DIRECTOR MEETINGS PER YEARª COMPANY SALES ($ IN MILLIONS) SEPARATE CHAIRMAN/CEO RETIREMENT AGE AVERAGE TENURE (years) BOARD RETAINER <strong>Board</strong> Retainer Footnotes INDEPENDENT DIRECTORS AVERAGE AGE all other OPTIONS TOTAL STOCK CASH Specialty Chemicals (continued) PPG Industries 15,330.0 10 8 Y 62 10 72 8 270,000 c,d 269,642 49% 47% 0% 4% Steel Nucor Corporation 16,439.3 8 7 N 62 7 72 4 95,000 b,c 247,533 43% 57% 0% 0% TOTAL MATERIALS Average 10.9 9.7 62.5 8.0 73.1 8.6 140,729 266,940 45% 50% 1% 4% Median 11.0 9.5 62.2 7.7 72.0 7.5 102,500 252,864 TELECOMMUNICATION SERVICES Alternative Carriers Level 3 Communications 8,229.0 11 10 Y 64 5 73 4 75,000 b 265,292 40% 60% 0% 0% Integrated Telecommunication Services AT&T 146,801.0 12 11 N 61 5 72 8 95,000 b,c 310,279 48% 48% 0% 4% CenturyLink 17,900.0 11 10 Y 62 11 75 10 65,000 b 297,031 45% 55% 0% 0% Frontier Communications Corporation 5,576.0 11 10 Y 62 8 - 16 95,000 b,c 225,000 42% 58% 0% 0% Verizon Communications 131,620.0 13 12 N 61 6 72 10 100,000 b 287,026 42% 57% 0% 1% TOTAL TELECOMMUNICATION SERVICES Average 11.6 10.6 61.7 7.0 73.0 9.6 86,000 276,786 44% 55% 0% 1% Median 11.0 10.0 61.6 6.2 72.5 10.0 95,000 287,026 UTILITIES Utilities Ameren Corporation 6,098.0 11 10 N 63 6 72 7 85,000 b,c 210,133 52% 48% 0% 0% American Electric Power Company 16,453.2 12 11 N 63 6 72 7 105,500 b,c 273,780 45% 55% 0% 0% American Water Works Company 3,159.0 9 8 Y 64 7 75 13 75,000 b 195,520 46% 53% 0% 1% CenterPoint Energy 7,386.0 9 7 Y 62 6 73 7 90,000 b 219,420 45% 55% 0% 0% CMS Energy Corporation 6,456.0 12 10 Y 61 5 75 8 95,000 b,c 233,222 49% 51% 0% 0% Consolidated Edison 12,554.0 10 8 N 66 10 75 10 100,000 b,c 257,437 50% 49% 0% 1% Dominion Resources 11,683.0 10 9 N 63 8 72 10 205,000 c,d 277,165 46% 46% 0% 8% DTE Energy Company 10,337.0 12 11 N 66 9 75 6 82,500 b,c 234,682 49% 51% 0% 0% Duke Energy Corporation 23,459.0 12 11 N 64 6 71 14 215,000 c,d 310,491 59% 41% 0% 0% Edison International 11,524.0 10 9 N 62 6 72 9 110,000 b 260,159 49% 48% 0% 3% Entergy Corporation 11,513.3 11 10 N 64 7 74 14 95,000 b 244,233 45% 45% 0% 10% Eversource Energy 7,954.8 12 11 N 68 8 75 7 100,000 b 208,655 51% 49% 0% 0% Exelon Corporation 29,447.0 13 12 Y 63 6 75 8 80,000 b 276,417 60% 36% 0% 4% FirstEnergy Corporation 15,026.0 14 13 Y 65 8 72 10 230,000 c,d 248,369 44% 53% 0% 3% NextEra Energy 17,486.0 12 11 N 63 8 72 6 220,000 d 251,833 46% 54% 0% 0% NiSource 4,651.8 9 8 Y 61 7 70 9 210,000 d 258,000 53% 47% 0% 0% NRG Energy 14,674.0 13 11 Y 65 9 75 9 225,000 b,d,f 260,697 44% 56% 0% 0% PG&E Corporation 16,833.0 12 11 N 65 8 72 12 120,000 b,c 257,460 53% 47% 0% 0% Pinnacle West Capital Corporation 3,495.4 10 9 N 68 12 - 7 95,000 b,c 203,057 51% 49% 0% 0% PPL Corporation 7,669.0 9 8 N 62 7 75 7 235,000 c,d,f 247,031 47% 52% 0% 1% 56 spencer stuart
number of directors independent directors <strong>Board</strong> fees ($) Percentage of total compensation AVERAGE COMPENSATION PER NON-EMPLOYEE DIRECTOR MEETINGS PER YEARª COMPANY SALES ($ IN MILLIONS) SEPARATE CHAIRMAN/CEO RETIREMENT AGE AVERAGE TENURE (years) BOARD RETAINER <strong>Board</strong> Retainer Footnotes INDEPENDENT DIRECTORS AVERAGE AGE all other OPTIONS TOTAL STOCK CASH Utilities (continued) Public Service Enterprise Group 10,415.0 11 10 N 67 11 72 9 85,000 b,c 239,798 50% 50% 0% 0% SCANA Corporation 4,380.0 11 10 N 60 10 70 9 193,000 c,d 199,378 42% 58% 0% 0% Sempra Energy 10,231.0 11 10 N 67 9 75 7 85,000 b,c 246,113 49% 45% 0% 6% Southern Company 17,489.0 15 14 N 65 6 72 9 110,000 b,c 242,657 47% 52% 0% 1% WEC Energy Group 5,926.1 13 11 Y 66 9 72 9 75,000 b 198,474 41% 50% 0% 9% Xcel Energy 11,024.5 11 10 N 62 10 72 6 90,000 b,c 240,229 20% 80% 0% 0% TOTAL UTILITIES Average 11.3 10.1 64.1 7.8 73.0 8.8 131,192 244,135 48% 50% 0% 2% Median 11.0 10.0 64.1 7.7 72.0 9.0 100,000 245,173 TOTAL S&P500 Average 10.8 9.2 63.1 8.5 73.3 8.4 118,521 285,065 38% 54% 6% 2% Median 11.0 9.0 63.0 8.2 72.0 7.5 100,000 269,642 Footnotes: a Includes regular, special and telephonic board meetings. b Equity (stock or stock units) is paid in addition to stated retainer. c Directors can elect to receive cash compensation fully or partially in stock. d Equity (stock or stock units) is paid as part of retainer. e Stock option program for directors exists. f Equity portion of retainer paid in deferred stock. g Retainer paid 100% in stock. h Directors can elect to receive equity retainer fully or partially in cash. i Directors can elect to receive cash and/or stock compensation in stock options. j Dollar value equivalent for retainer not provided in proxy. k Directors can elect to receive stock in lieu of stock option grant. board index 2016 57