

Polar Bear
PBRT_Recovery_%20Plan_Book_FINAL_signed
PBRT_Recovery_%20Plan_Book_FINAL_signed

You also want an ePaper? Increase the reach of your titles
YUMPU automatically turns print PDFs into web optimized ePapers that Google loves.
Appendix C—Population Dynamics and Harvest Management<br />
Demographic Rate<br />
0.4<br />
0.3<br />
0.2<br />
0.1<br />
Original reproductive rate<br />
Loss of habitat quantity<br />
Loss of habitat quality<br />
Mortality rate<br />
Annual Harvest<br />
Original reproductive rate<br />
Loss of habitat quantity<br />
Loss of habitat quality<br />
0.0<br />
0 K 1 K 0<br />
Population Size<br />
0.4<br />
0<br />
0 K 1 K 0<br />
Population Size<br />
Demographic Rate<br />
0.3<br />
0.2<br />
0.1<br />
0.0<br />
0 K 1 K 0<br />
Population Size<br />
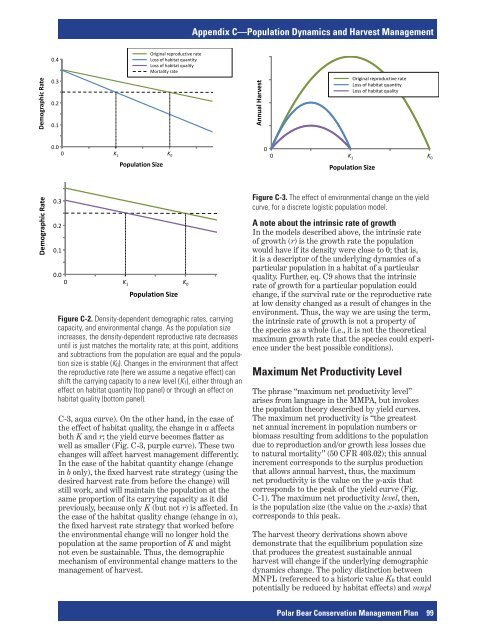
Figure C-2. Density-dependent demographic rates, carrying<br />
capacity, and environmental change. As the population size<br />
increases, the density-dependent reproductive rate decreases<br />
until is just matches the mortality rate; at this point, additions<br />
and subtractions from the population are equal and the population<br />
size is stable (K 0 ). Changes in the environment that affect<br />
the reproductive rate (here we assume a negative effect) can<br />
shift the carrying capacity to a new level (K 1 ), either through an<br />
effect on habitat quantity (top panel) or through an effect on<br />
habitat quality (bottom panel).<br />
C-3, aqua curve). On the other hand, in the case of<br />
the effect of habitat quality, the change in a affects<br />
both K and r; the yield curve becomes flatter as<br />
well as smaller (Fig. C-3, purple curve). These two<br />
changes will affect harvest management differently.<br />
In the case of the habitat quantity change (change<br />
in b only), the fixed harvest rate strategy (using the<br />
desired harvest rate from before the change) will<br />
still work, and will maintain the population at the<br />
same proportion of its carrying capacity as it did<br />
previously, because only K (but not r) is affected. In<br />
the case of the habitat quality change (change in a),<br />
the fixed harvest rate strategy that worked before<br />
the environmental change will no longer hold the<br />
population at the same proportion of K and might<br />
not even be sustainable. Thus, the demographic<br />
mechanism of environmental change matters to the<br />
management of harvest.<br />
Figure C-3. The effect of environmental change on the yield<br />
curve, for a discrete logistic population model.<br />
A note about the intrinsic rate of growth<br />
In the models described above, the intrinsic rate<br />
of growth (r) is the growth rate the population<br />
would have if its density were close to 0; that is,<br />
it is a descriptor of the underlying dynamics of a<br />
particular population in a habitat of a particular<br />
quality. Further, eq. C9 shows that the intrinsic<br />
rate of growth for a particular population could<br />
change, if the survival rate or the reproductive rate<br />
at low density changed as a result of changes in the<br />
environment. Thus, the way we are using the term,<br />
the intrinsic rate of growth is not a property of<br />
the species as a whole (i.e., it is not the theoretical<br />
maximum growth rate that the species could experience<br />
under the best possible conditions).<br />
Maximum Net Productivity Level<br />
The phrase “maximum net productivity level”<br />
arises from language in the MMPA, but invokes<br />
the population theory described by yield curves.<br />
The maximum net productivity is “the greatest<br />
net annual increment in population numbers or<br />
biomass resulting from additions to the population<br />
due to reproduction and/or growth less losses due<br />
to natural mortality” (50 CFR 403.02); this annual<br />
increment corresponds to the surplus production<br />
that allows annual harvest, thus, the maximum<br />
net productivity is the value on the y-axis that<br />
corresponds to the peak of the yield curve (Fig.<br />
C-1). The maximum net productivity level, then,<br />
is the population size (the value on the x-axis) that<br />
corresponds to this peak.<br />
The harvest theory derivations shown above<br />
demonstrate that the equilibrium population size<br />
that produces the greatest sustainable annual<br />
harvest will change if the underlying demographic<br />
dynamics change. The policy distinction between<br />
MNPL (referenced to a historic value K 0 that could<br />
potentially be reduced by habitat effects) and mnpl<br />
<strong>Polar</strong> <strong>Bear</strong> Conservation Management Plan 99