

Subject
StatementofAccounts2015-2016V11StA
StatementofAccounts2015-2016V11StA

You also want an ePaper? Increase the reach of your titles
YUMPU automatically turns print PDFs into web optimized ePapers that Google loves.
Notes to the Core Financial Statements<br />
Day to Day Spending - Revenue<br />
Day to Day Spending – Revenue<br />
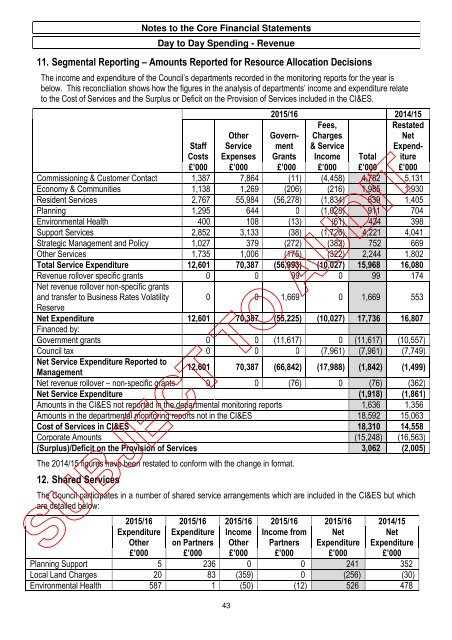
11. Segmental Reporting – Amounts Reported for Resource Allocation Decisions<br />
The income and expenditure of the Council’s departments recorded in the monitoring reports for the year is<br />
below. This reconciliation shows how the figures in the analysis of departments’ income and expenditure relate<br />
to the Cost of Services and the Surplus or Deficit on the Provision of Services included in the CI&ES.<br />
Other<br />
Service<br />
Expenses<br />
43<br />
2015/16 2014/15<br />
Fees,<br />
Restated<br />
Government<br />
Charges<br />
Net<br />
& Service<br />
Expend-<br />
Grants Income Total iture<br />
Staff<br />
Costs<br />
£’000 £’000 £’000 £’000 £’000 £’000<br />
Commissioning & Customer Contact 1,387 7,864 (11) (4,458) 4,782. 5,131.<br />
Economy & Communities 1,138 1,269 (206) (216) 1,985. 1,930.<br />
Resident Services 2,767 55,984 (56,278) (1,834) 639. 1,405.<br />
Planning 1,295 644 0. (1,028) 911. 704.<br />
Environmental Health 400 108 (13) (61) 434 398.<br />
Support Services 2,852 3,133 (38) (1,726) 4,221 4,041.<br />
Strategic Management and Policy 1,027 379 (272) (382) 752 669.<br />
Other Services 1,735 1,006 (175) (322) 2,244 1,802.<br />
Total Service Expenditure 12,601 70,387 (56,993) (10,027) 15,968. 16,080.<br />
Revenue rollover specific grants 0 0 99. 0. 99. 174.<br />
Net revenue rollover non-specific grants<br />
and transfer to Business Rates Volatility<br />
Reserve<br />
0 0 1,669. 0. 1,669. 553.<br />
Net Expenditure 12,601 70,387 (55,225) (10,027) 17,736. 16,807.<br />
Financed by:<br />
Government grants 0 0 (11,617) 0. (11,617) (10,557)<br />
Council tax 0 0 0. (7,961) (7,961) (7,749)<br />
Net Service Expenditure Reported to<br />
12,601 70,387 (66,842) (17,988) (1,842) (1,499)<br />
Management<br />
Net revenue rollover – non-specific grants 0 0 (76) 0. (76) (362)<br />
Net Service Expenditure (1,918) (1,861)<br />
Amounts in the CI&ES not reported in the departmental monitoring reports 1,636. 1,356.<br />
Amounts in the departmental monitoring reports not in the CI&ES 18,592. 15,063.<br />
Cost of Services in CI&ES 18,310. 14,558.<br />
Corporate Amounts (15,248) (16,563)<br />
(Surplus)/Deficit on the Provision of Services 3,062. (2,005)<br />
The 2014/15 figures have been restated to conform with the change in format.<br />
12. Shared Services<br />
The Council participates in a number of shared service arrangements which are included in the CI&ES but which<br />
are detailed below:<br />
2015/16 2015/16 2015/16 2015/16 2015/16 2014/15<br />
Expenditure<br />
Other<br />
Expenditure<br />
on Partners<br />
Income<br />
Other<br />
Income from<br />
Partners<br />
Net<br />
Expenditure<br />
Net<br />
Expenditure<br />
£’000 £’000 £’000 £’000 £’000 £’000<br />
Planning Support 5 236 0. 0. 241. 352.<br />
Local Land Charges 20 83 (359) 0. (256) (30)<br />
Environmental Health 587 1 (50) (12) 526. 478.