

Subject
StatementofAccounts2015-2016V11StA
StatementofAccounts2015-2016V11StA

You also want an ePaper? Increase the reach of your titles
YUMPU automatically turns print PDFs into web optimized ePapers that Google loves.
Reviewing Our Performance<br />
Reviewing Our Performance<br />
Reviewing Our Performance<br />
The Conservatives retained control of the Council following the elections in May 2015, so that the new<br />
corporate plan adopted by the Council in February 2015 remained in operation for the whole of 2015/16 (see<br />
http://www.swale.gov.uk/corporate-plan-2015-2018/). The new plan represents an evolution from previous<br />
plans, containing 15 medium-term strategic objectives grouped under three headline ‘priority themes’ covering<br />
the Council’s aspirations for the borough as a physical place, for the local community, and for its own<br />
organisational culture and development. The Council’s Annual Report will set out in detail progress against<br />
the Corporate Plan.<br />
The Council continues to monitor its performance against a range of key performance indicators and, where<br />
possible, to benchmark our performance with that of other local authorities. In addition to numerous indicators<br />
in use within specialist teams, Cabinet, Scrutiny and the management team monitor a set of 40 ‘corporate’<br />
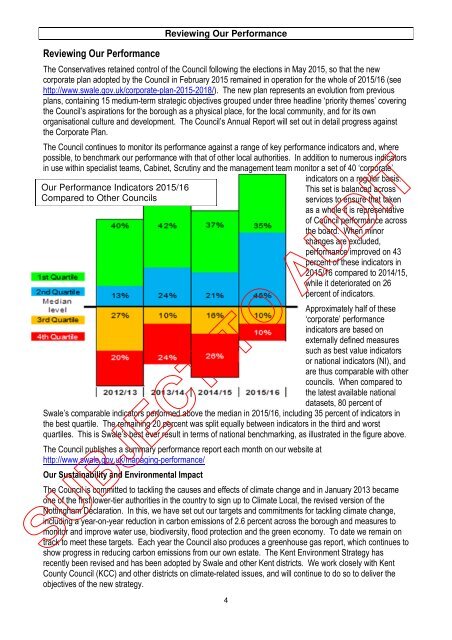
Our Performance Indicators 2015/16<br />
Compared to Other Councils<br />
4<br />
indicators on a regular basis.<br />
This set is balanced across<br />
services to ensure that taken<br />
as a whole it is representative<br />
of Council performance across<br />
the board. When minor<br />
changes are excluded,<br />
performance improved on 43<br />
percent of these indicators in<br />
2015/16 compared to 2014/15,<br />
while it deteriorated on 26<br />
percent of indicators.<br />
Approximately half of these<br />
‘corporate’ performance<br />
indicators are based on<br />
externally defined measures<br />
such as best value indicators<br />
or national indicators (NI), and<br />
are thus comparable with other<br />
councils. When compared to<br />
the latest available national<br />
datasets, 80 percent of<br />
Swale’s comparable indicators performed above the median in 2015/16, including 35 percent of indicators in<br />
the best quartile. The remaining 20 percent was split equally between indicators in the third and worst<br />
quartiles. This is Swale’s best ever result in terms of national benchmarking, as illustrated in the figure above.<br />
The Council publishes a summary performance report each month on our website at<br />
http://www.swale.gov.uk/managing-performance/<br />
Our Sustainability and Environmental Impact<br />
The Council is committed to tackling the causes and effects of climate change and in January 2013 became<br />
one of the first lower-tier authorities in the country to sign up to Climate Local, the revised version of the<br />
Nottingham Declaration. In this, we have set out our targets and commitments for tackling climate change,<br />
including a year-on-year reduction in carbon emissions of 2.6 percent across the borough and measures to<br />
monitor and improve water use, biodiversity, flood protection and the green economy. To date we remain on<br />
track to meet these targets. Each year the Council also produces a greenhouse gas report, which continues to<br />
show progress in reducing carbon emissions from our own estate. The Kent Environment Strategy has<br />
recently been revised and has been adopted by Swale and other Kent districts. We work closely with Kent<br />
County Council (KCC) and other districts on climate-related issues, and will continue to do so to deliver the<br />
objectives of the new strategy.