Province of Siquijor - UNDP in the Philippines
Province of Siquijor - UNDP in the Philippines
Province of Siquijor - UNDP in the Philippines
You also want an ePaper? Increase the reach of your titles
YUMPU automatically turns print PDFs into web optimized ePapers that Google loves.
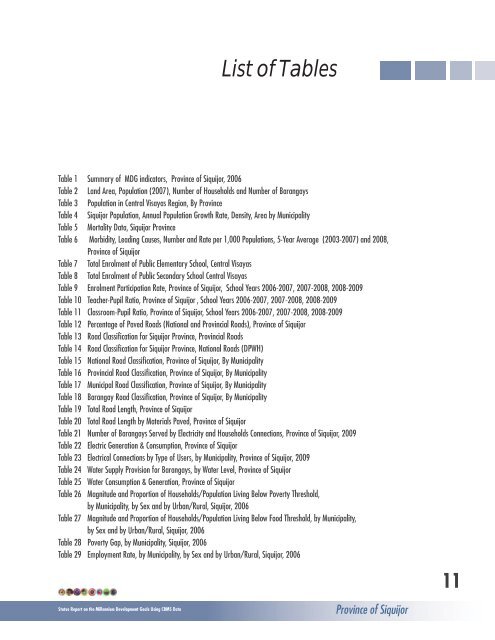
List <strong>of</strong> Tables<br />
Table 1 Summary <strong>of</strong> MDG <strong>in</strong>dicators, <strong>Prov<strong>in</strong>ce</strong> <strong>of</strong> <strong>Siquijor</strong>, 2006<br />
Table 2 Land Area, Population (2007), Number <strong>of</strong> Households and Number <strong>of</strong> Barangays<br />
Table 3 Population <strong>in</strong> Central Visayas Region, By <strong>Prov<strong>in</strong>ce</strong><br />
Table 4 <strong>Siquijor</strong> Population, Annual Population Growth Rate, Density, Area by Municipality<br />
Table 5 Mortality Data, <strong>Siquijor</strong> <strong>Prov<strong>in</strong>ce</strong><br />
Table 6 Morbidity, Lead<strong>in</strong>g Causes, Number and Rate per 1,000 Populations, 5-Year Average (2003-2007) and 2008,<br />
<strong>Prov<strong>in</strong>ce</strong> <strong>of</strong> <strong>Siquijor</strong><br />
Table 7 Total Enrolment <strong>of</strong> Public Elementary School, Central Visayas<br />
Table 8 Total Enrolment <strong>of</strong> Public Secondary School Central Visayas<br />
Table 9 Enrolment Participation Rate, <strong>Prov<strong>in</strong>ce</strong> <strong>of</strong> <strong>Siquijor</strong>, School Years 2006-2007, 2007-2008, 2008-2009<br />
Table 10 Teacher-Pupil Ratio, <strong>Prov<strong>in</strong>ce</strong> <strong>of</strong> <strong>Siquijor</strong> , School Years 2006-2007, 2007-2008, 2008-2009<br />
Table 11 Classroom-Pupil Ratio, <strong>Prov<strong>in</strong>ce</strong> <strong>of</strong> <strong>Siquijor</strong>, School Years 2006-2007, 2007-2008, 2008-2009<br />
Table 12 Percentage <strong>of</strong> Paved Roads (National and Prov<strong>in</strong>cial Roads), <strong>Prov<strong>in</strong>ce</strong> <strong>of</strong> <strong>Siquijor</strong><br />
Table 13 Road Classification for <strong>Siquijor</strong> <strong>Prov<strong>in</strong>ce</strong>, Prov<strong>in</strong>cial Roads<br />
Table 14 Road Classification for <strong>Siquijor</strong> <strong>Prov<strong>in</strong>ce</strong>, National Roads (DPWH)<br />
Table 15 National Road Classification, <strong>Prov<strong>in</strong>ce</strong> <strong>of</strong> <strong>Siquijor</strong>, By Municipality<br />
Table 16 Prov<strong>in</strong>cial Road Classification, <strong>Prov<strong>in</strong>ce</strong> <strong>of</strong> <strong>Siquijor</strong>, By Municipality<br />
Table 17 Municipal Road Classification, <strong>Prov<strong>in</strong>ce</strong> <strong>of</strong> <strong>Siquijor</strong>, By Municipality<br />
Table 18 Barangay Road Classification, <strong>Prov<strong>in</strong>ce</strong> <strong>of</strong> <strong>Siquijor</strong>, By Municipality<br />
Table 19 Total Road Length, <strong>Prov<strong>in</strong>ce</strong> <strong>of</strong> <strong>Siquijor</strong><br />
Table 20 Total Road Length by Materials Paved, <strong>Prov<strong>in</strong>ce</strong> <strong>of</strong> <strong>Siquijor</strong><br />
Table 21 Number <strong>of</strong> Barangays Served by Electricity and Households Connections, <strong>Prov<strong>in</strong>ce</strong> <strong>of</strong> <strong>Siquijor</strong>, 2009<br />
Table 22 Electric Generation & Consumption, <strong>Prov<strong>in</strong>ce</strong> <strong>of</strong> <strong>Siquijor</strong><br />
Table 23 Electrical Connections by Type <strong>of</strong> Users, by Municipality, <strong>Prov<strong>in</strong>ce</strong> <strong>of</strong> <strong>Siquijor</strong>, 2009<br />
Table 24 Water Supply Provision for Barangays, by Water Level, <strong>Prov<strong>in</strong>ce</strong> <strong>of</strong> <strong>Siquijor</strong><br />
Table 25 Water Consumption & Generation, <strong>Prov<strong>in</strong>ce</strong> <strong>of</strong> <strong>Siquijor</strong><br />
Table 26 Magnitude and Proportion <strong>of</strong> Households/Population Liv<strong>in</strong>g Below Poverty Threshold,<br />
by Municipality, by Sex and by Urban/Rural, <strong>Siquijor</strong>, 2006<br />
Table 27 Magnitude and Proportion <strong>of</strong> Households/Population Liv<strong>in</strong>g Below Food Threshold, by Municipality,<br />
by Sex and by Urban/Rural, <strong>Siquijor</strong>, 2006<br />
Table 28 Poverty Gap, by Municipality, <strong>Siquijor</strong>, 2006<br />
Table 29 Employment Rate, by Municipality, by Sex and by Urban/Rural, <strong>Siquijor</strong>, 2006<br />
Status Report on <strong>the</strong> Millennium Development Goals Us<strong>in</strong>g CBMS Data <strong>Prov<strong>in</strong>ce</strong> <strong>of</strong> <strong>Siquijor</strong><br />
11


