Province of Siquijor - UNDP in the Philippines
Province of Siquijor - UNDP in the Philippines
Province of Siquijor - UNDP in the Philippines

Create successful ePaper yourself
Turn your PDF publications into a flip-book with our unique Google optimized e-Paper software.
y 6,097 persons over <strong>the</strong> population count<br />
<strong>of</strong> 81,598 persons <strong>in</strong> 2000 or 7.47 percent<br />
<strong>in</strong>crease over <strong>the</strong> 2000 count. The recent<br />
population count for <strong>the</strong> prov<strong>in</strong>ce translates<br />
to an annual growth rate <strong>of</strong> 1.0 percent for<br />
<strong>the</strong> period 2000 to 2007. It is lower than<br />
<strong>the</strong> 2.2 percent annual growth rate for <strong>the</strong><br />
period 1995-2000 by 1.2 percent.<br />
In <strong>the</strong> whole <strong>of</strong> Region VII, <strong>Siquijor</strong> registered<br />
<strong>the</strong> lowest annual population growth<br />
rate (APGR), followed by Bohol’s 1.1 percent<br />
and Negros Oriental’s 1.2 percent. The<br />
prov<strong>in</strong>ce with <strong>the</strong> highest APGR is Cebu.<br />
The three prov<strong>in</strong>ces <strong>of</strong> <strong>Siquijor</strong>, Bohol and<br />
Negros Oriental have lower APGRs than<br />
<strong>the</strong> regional rate while Cebu exceeded <strong>the</strong><br />
regional APGR by 0.1 percent. Region<br />
VII, however, still has a lower APGR than<br />
<strong>the</strong> national figure. In 2000, Cebu had <strong>the</strong><br />
highest population density <strong>of</strong> 489 persons/<br />
sq.km. Bohol followed with 276 persons/<br />
sq.km., <strong>the</strong>n <strong>Siquijor</strong> with 256 persons/<br />
sq.km. and f<strong>in</strong>ally, Negros Oriental with <strong>the</strong><br />
lowest population density <strong>of</strong> 208.4 persons/<br />
sq.km. Only Cebu had a population density<br />
higher than <strong>the</strong> regional population density<br />
<strong>of</strong> 381 persons/sq.km. Compared with <strong>the</strong><br />
national figure, Cebu and Bohol registered<br />
higher population densities.<br />
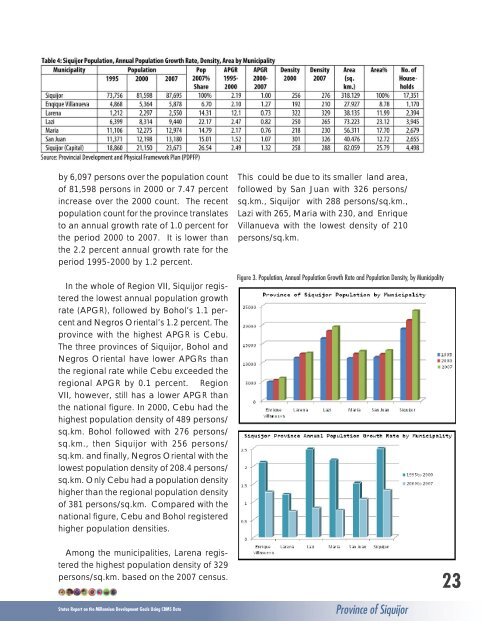
Among <strong>the</strong> municipalities, Larena registered<br />
<strong>the</strong> highest population density <strong>of</strong> 329<br />
persons/sq.km. based on <strong>the</strong> 2007 census.<br />
This could be due to its smaller land area,<br />
followed by San Juan with 326 persons/<br />
sq.km., <strong>Siquijor</strong> with 288 persons/sq.km.,<br />
Lazi with 265, Maria with 230, and Enrique<br />
Villanueva with <strong>the</strong> lowest density <strong>of</strong> 210<br />
persons/sq.km.<br />
Figure 3. Population, Annual Population Growth Rate and Population Density, by Municipality<br />
Status Report on <strong>the</strong> Millennium Development Goals Us<strong>in</strong>g CBMS Data <strong>Prov<strong>in</strong>ce</strong> <strong>of</strong> <strong>Siquijor</strong><br />
23