semi-annual report 30 Sep 2008 - SEB Asset Management
semi-annual report 30 Sep 2008 - SEB Asset Management
semi-annual report 30 Sep 2008 - SEB Asset Management

Create successful ePaper yourself
Turn your PDF publications into a flip-book with our unique Google optimized e-Paper software.
market conditions, given that factors such as high<br />
contributions towards fit-out costs are standard on the<br />
rental market.<br />
The changes in value item include both changes in<br />
value according to the expert opinions and other changes<br />
in value, such as provisions for planned construction<br />
measures. The return from changes in value was a positive<br />
0.8 percentage points. A major factor in this development<br />
was a new lease signed at much better conditions (+ 2.8%)<br />
in Italy. The positive result in France (+ 1.1%) is also due to<br />
successes in letting properties, which also had a significant<br />
impact on the positive changes in the value of the equity<br />
interests.<br />
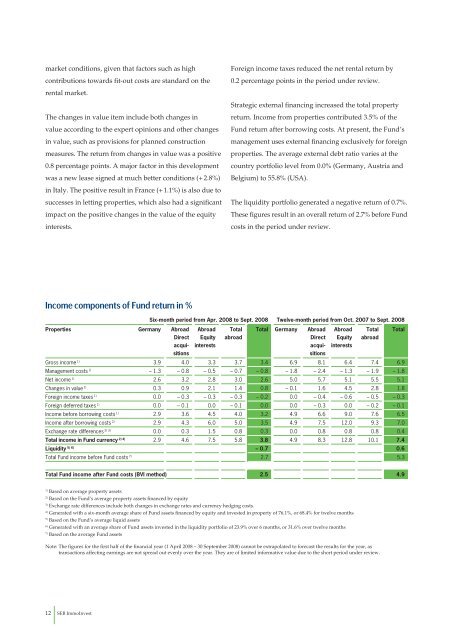
Income components of Fund return in %<br />
Properties Germany Abroad<br />
12 <strong>SEB</strong> ImmoInvest<br />
Six-month period from Apr. <strong>2008</strong> to <strong>Sep</strong>t. <strong>2008</strong> Twelve-month period from Oct. 2007 to <strong>Sep</strong>t. <strong>2008</strong><br />
Direct<br />
acqui-<br />
sitions<br />
Abroad<br />
Equity<br />
interests<br />
Total<br />
abroad<br />
Total Germany Abroad<br />
Direct<br />
acqui-<br />
sitions<br />
Abroad<br />
Equity<br />
interests<br />
Gross income 1) 3.9 4.0 3.3 3.7 3.4 6.9 8.1 6.4 7.4 6.9<br />
<strong>Management</strong> costs 1) – 1.3 – 0.8 – 0.5 – 0.7 – 0.8 – 1.8 – 2.4 – 1.3 – 1.9 – 1.8<br />
Net income 1) 2.6 3.2 2.8 3.0 2.6 5.0 5.7 5.1 5.5 5.1<br />
Changes in value 1) 0.3 0.9 2.1 1.4 0.8 – 0.1 1.6 4.5 2.8 1.8<br />
Foreign income taxes 1) 0.0 – 0.3 – 0.3 – 0.3 – 0.2 0.0 – 0.4 – 0.6 – 0.5 – 0.3<br />
Foreign deferred taxes 1) 0.0 – 0.1 0.0 – 0.1 0.0 0.0 – 0.3 0.0 – 0.2 – 0.1<br />
Income before borrowing costs 1) 2.9 3.6 4.5 4.0 3.2 4.9 6.6 9.0 7.6 6.5<br />
Income after borrowing costs 2) 2.9 4.3 6.0 5.0 3.5 4.9 7.5 12.0 9.3 7.0<br />
Exchange rate differences 2) 3) 0.0 0.3 1.5 0.8 0.3 0.0 0.8 0.8 0.8 0.4<br />
Total income in Fund currency 2) 4) 2.9 4.6 7.5 5.8 3.8 4.9 8.3 12.8 10.1 7.4<br />
Liquidity 5) 6) – 0.7 0.6<br />
Total Fund income before Fund costs 7) 2.7 5.3<br />
Total Fund income after Fund costs (BVI method) 2.5 4.9<br />
1) Based on average property assets<br />
2) Based on the Fund’s average property assets financed by equity<br />
3) Exchange rate differences include both changes in exchange rates and currency hedging costs.<br />
4) Generated with a six-month average share of Fund assets financed by equity and invested in property of 76.1%, or 68.4% for twelve months<br />
5) Based on the Fund’s average liquid assets<br />
6) Generated with an average share of Fund assets invested in the liquidity portfolio of 23.9% over 6 months, or 31.6% over twelve months<br />
7) Based on the average Fund assets<br />
Foreign income taxes reduced the net rental return by<br />
0.2 percentage points in the period under review.<br />
Strategic external financing increased the total property<br />
return. Income from properties contributed 3.5% of the<br />
Fund return after borrowing costs. At present, the Fund’s<br />
management uses external financing exclusively for foreign<br />
properties. The average external debt ratio varies at the<br />
country portfolio level from 0.0% (Germany, Austria and<br />
Belgium) to 55.8% (USA).<br />
The liquidity portfolio generated a negative return of 0.7%.<br />
These figures result in an overall return of 2.7% before Fund<br />
costs in the period under review.<br />
Total<br />
abroad<br />
Note: The figures for the first half of the financial year (1 April <strong>2008</strong> – <strong>30</strong> <strong>Sep</strong>tember <strong>2008</strong>) cannot be extrapolated to forecast the results for the year, as<br />
transactions affecting earnings are not spread out evenly over the year. They are of limited informative value due to the short period under review.<br />
Total