semi-annual report 30 Sep 2008 - SEB Asset Management
semi-annual report 30 Sep 2008 - SEB Asset Management
semi-annual report 30 Sep 2008 - SEB Asset Management

Create successful ePaper yourself
Turn your PDF publications into a flip-book with our unique Google optimized e-Paper software.
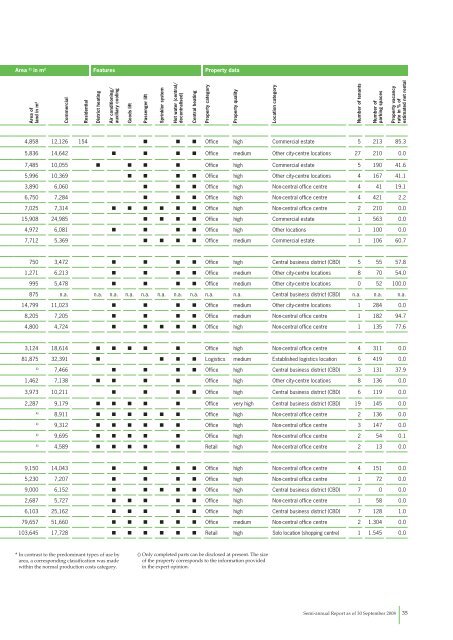
Area 2) in m 2 Features Property data<br />
Area of<br />
land in m2 Commercial<br />
Residential<br />
District heating<br />
Air conditioning/<br />
auxiliary cooling<br />
Goods lift<br />
Passenger lift<br />
Sprinkler system<br />
Hot water (central/<br />
decentralised)<br />
Central heating<br />
Property category<br />
4,858 12,126 154 W W W Office high Commercial estate 5 213 85.3<br />
5,836 14,642 W W W W Office medium Other city-centre locations 27 210 0.0<br />
7,485 10,055 W W W W Office high Commercial estate 5 190 41.6<br />
5,996 10,369 W W W W Office high Other city-centre locations 4 167 41.1<br />
3,890 6,060 W W W Office high Non-central office centre 4 41 19.1<br />
6,750 7,284 W W W Office high Non-central office centre 4 421 2.2<br />
7,025 7,314 W W W W W W Office high Non-central office centre 2 210 0.0<br />
15,908 24,985 W W W W Office high Commercial estate 1 563 0.0<br />
4,972 6,081 W W W W Office high Other locations 1 100 0.0<br />
7,712 5,369 W W W W Office medium Commercial estate 1 106 60.7<br />
750 3,472 W W W W Office high Central business district (CBD) 5 55 57.8<br />
1,271 6,213 W W W W Office medium Other city-centre locations 8 70 54.0<br />
995 5,478 W W W W Office medium Other city-centre locations 0 52 100.0<br />
875 n.a. n.a. n.a. n.a. n.a. n.a. n.a. n.a. n.a. n.a. Central business district (CBD) n.a. n.a. n.a.<br />
14,799 11,023 W W W W Office medium Other city-centre locations 1 284 0.0<br />
8,205 7,205 W W W W Office medium Non-central office centre 1 182 94.7<br />
4,800 4,724 W W W W W Office high Non-central office centre 1 135 77.6<br />
3,124 18,614 W W W W W Office high Non-central office centre 4 311 0.0<br />
81,875 32,391 W W W W Logistics medium Established logistics location 6 419 0.0<br />
4) 7,466 W W W W Office high Central business district (CBD) 3 131 37.9<br />
1,462 7,138 W W W W Office high Other city-centre locations 8 136 0.0<br />
3,973 10,211 W W W W Office high Central business district (CBD) 6 119 0.0<br />
2,287 9,179 W W W W W Office very high Central business district (CBD) 19 145 0.0<br />
4) 8,911 W W W W W W Office high Non-central office centre 2 136 0.0<br />
4) 9,312 W W W W W W Office high Non-central office centre 3 147 0.0<br />
4) 9,695 W W W W W Office high Non-central office centre 2 54 0.1<br />
4) 4,589 W W W W W Retail high Non-central office centre 2 13 0.0<br />
9,150 14,043 W W W W Office high Non-central office centre 4 151 0.0<br />
5,2<strong>30</strong> 7,207 W W W W Office high Non-central office centre 1 72 0.0<br />
9,000 6,152 W W W W W Office high Central business district (CBD) 7 0 0.0<br />
2,687 5,727 W W W W W Office high Non-central office centre 1 58 0.0<br />
6,103 25,162 W W W W W Office high Central business district (CBD) 7 128 1.0<br />
79,657 51,660 W W W W W W Office medium Non-central office centre 2 1.<strong>30</strong>4 0.0<br />
103,645 17,728 W W W W W W Retail high Solo location (shopping centre) 1 1.545 0.0<br />
* In contrast to the predominant types of use by<br />
area, a corresponding classification was made<br />
within the normal production costs category.<br />
() Only completed parts can be disclosed at present. The size<br />
of the property corresponds to the information provided<br />
in the expert opinion.<br />
Property quality<br />
Location category<br />
Number of tenants<br />
Number of<br />
parking spaces<br />
Property vacancy<br />
rate in % of<br />
estimated net rental<br />
Semi-<strong>annual</strong> Report as of <strong>30</strong> <strong>Sep</strong>tember <strong>2008</strong> 35